Internal Tool
Cricket Client
A responsive redesign that earned 100% analyst approval in testing and became the model for multi-sport implementation.
Category
Product Design
Client
Stats Perform
Year
2023
Project overview
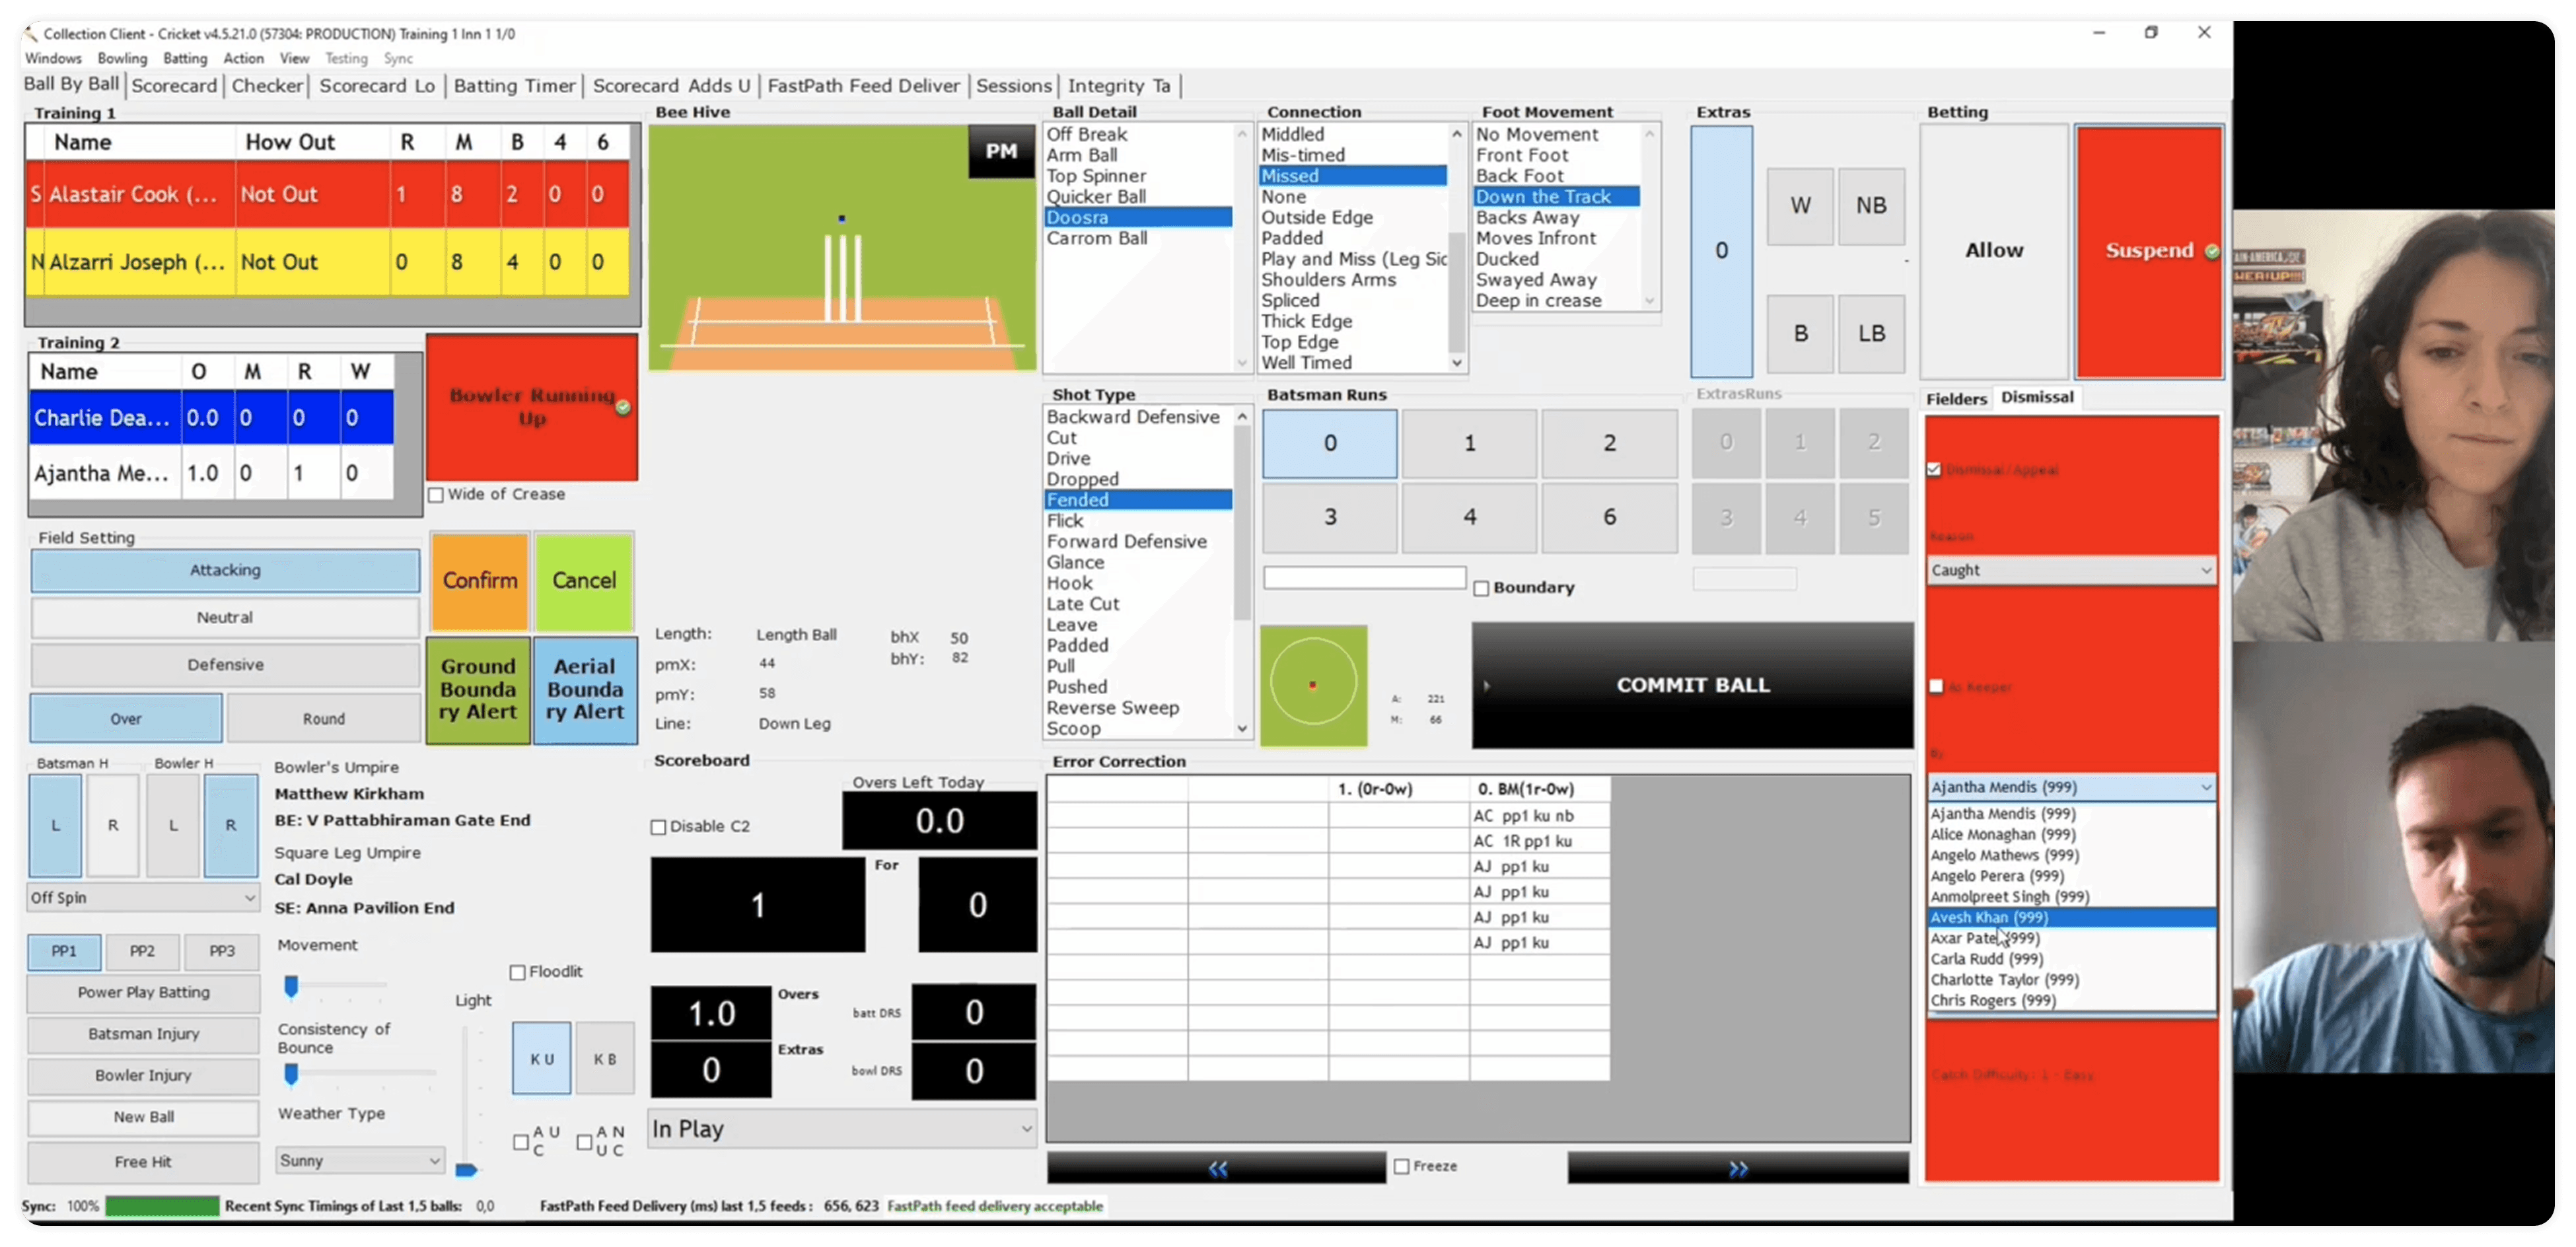
Stats Perform's cricket database stretches back to 1877. Behind it are 30+ data operation analysts manually collecting every ball, every delivery, every event across international matches, T20 leagues, and major domestic competitions. The tool they used to do it had not meaningfully changed in years.
In effort to expand coverage to lower-tier matches, they planned to deploy in-ground analysts collecting data from the stands using mobile devices, particularly in venues without a scorer's box or the infrastructure for a desktop setup. Since the existing collection tool was desktop-only, the response from the operations team was to build a separate mobile app.
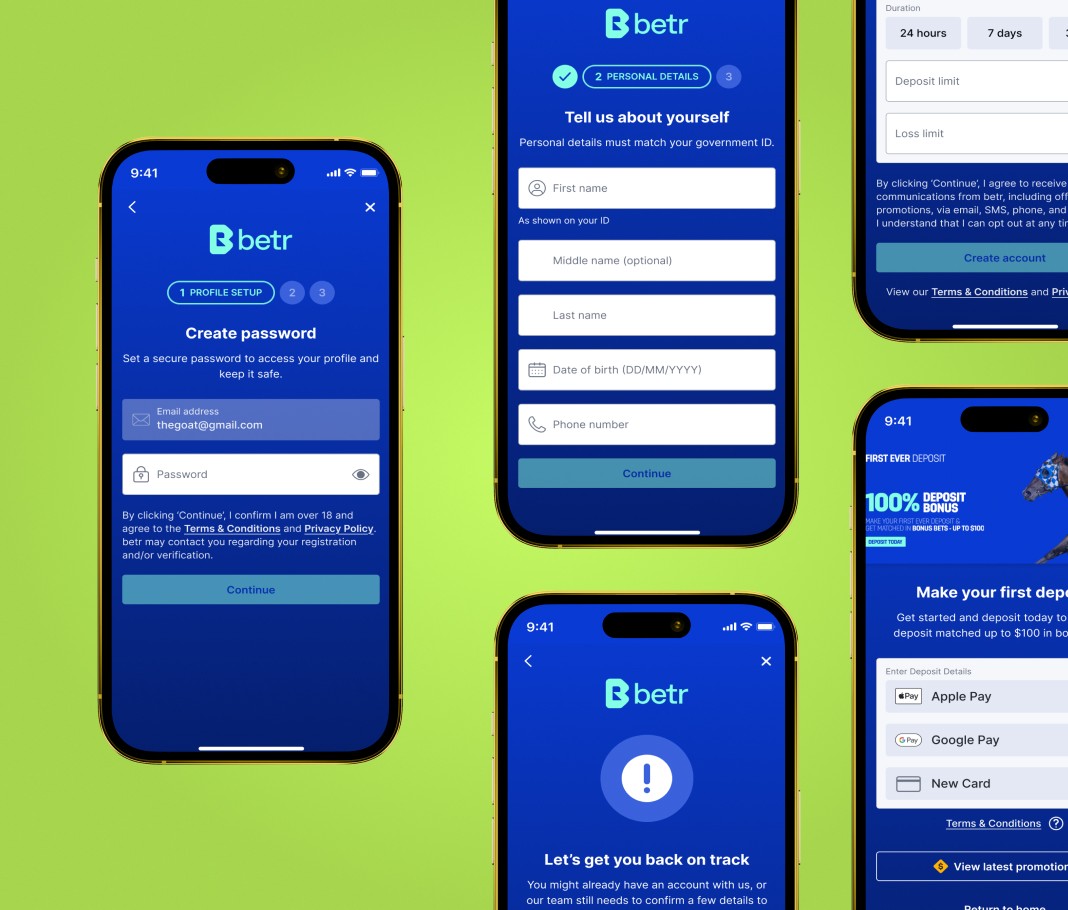
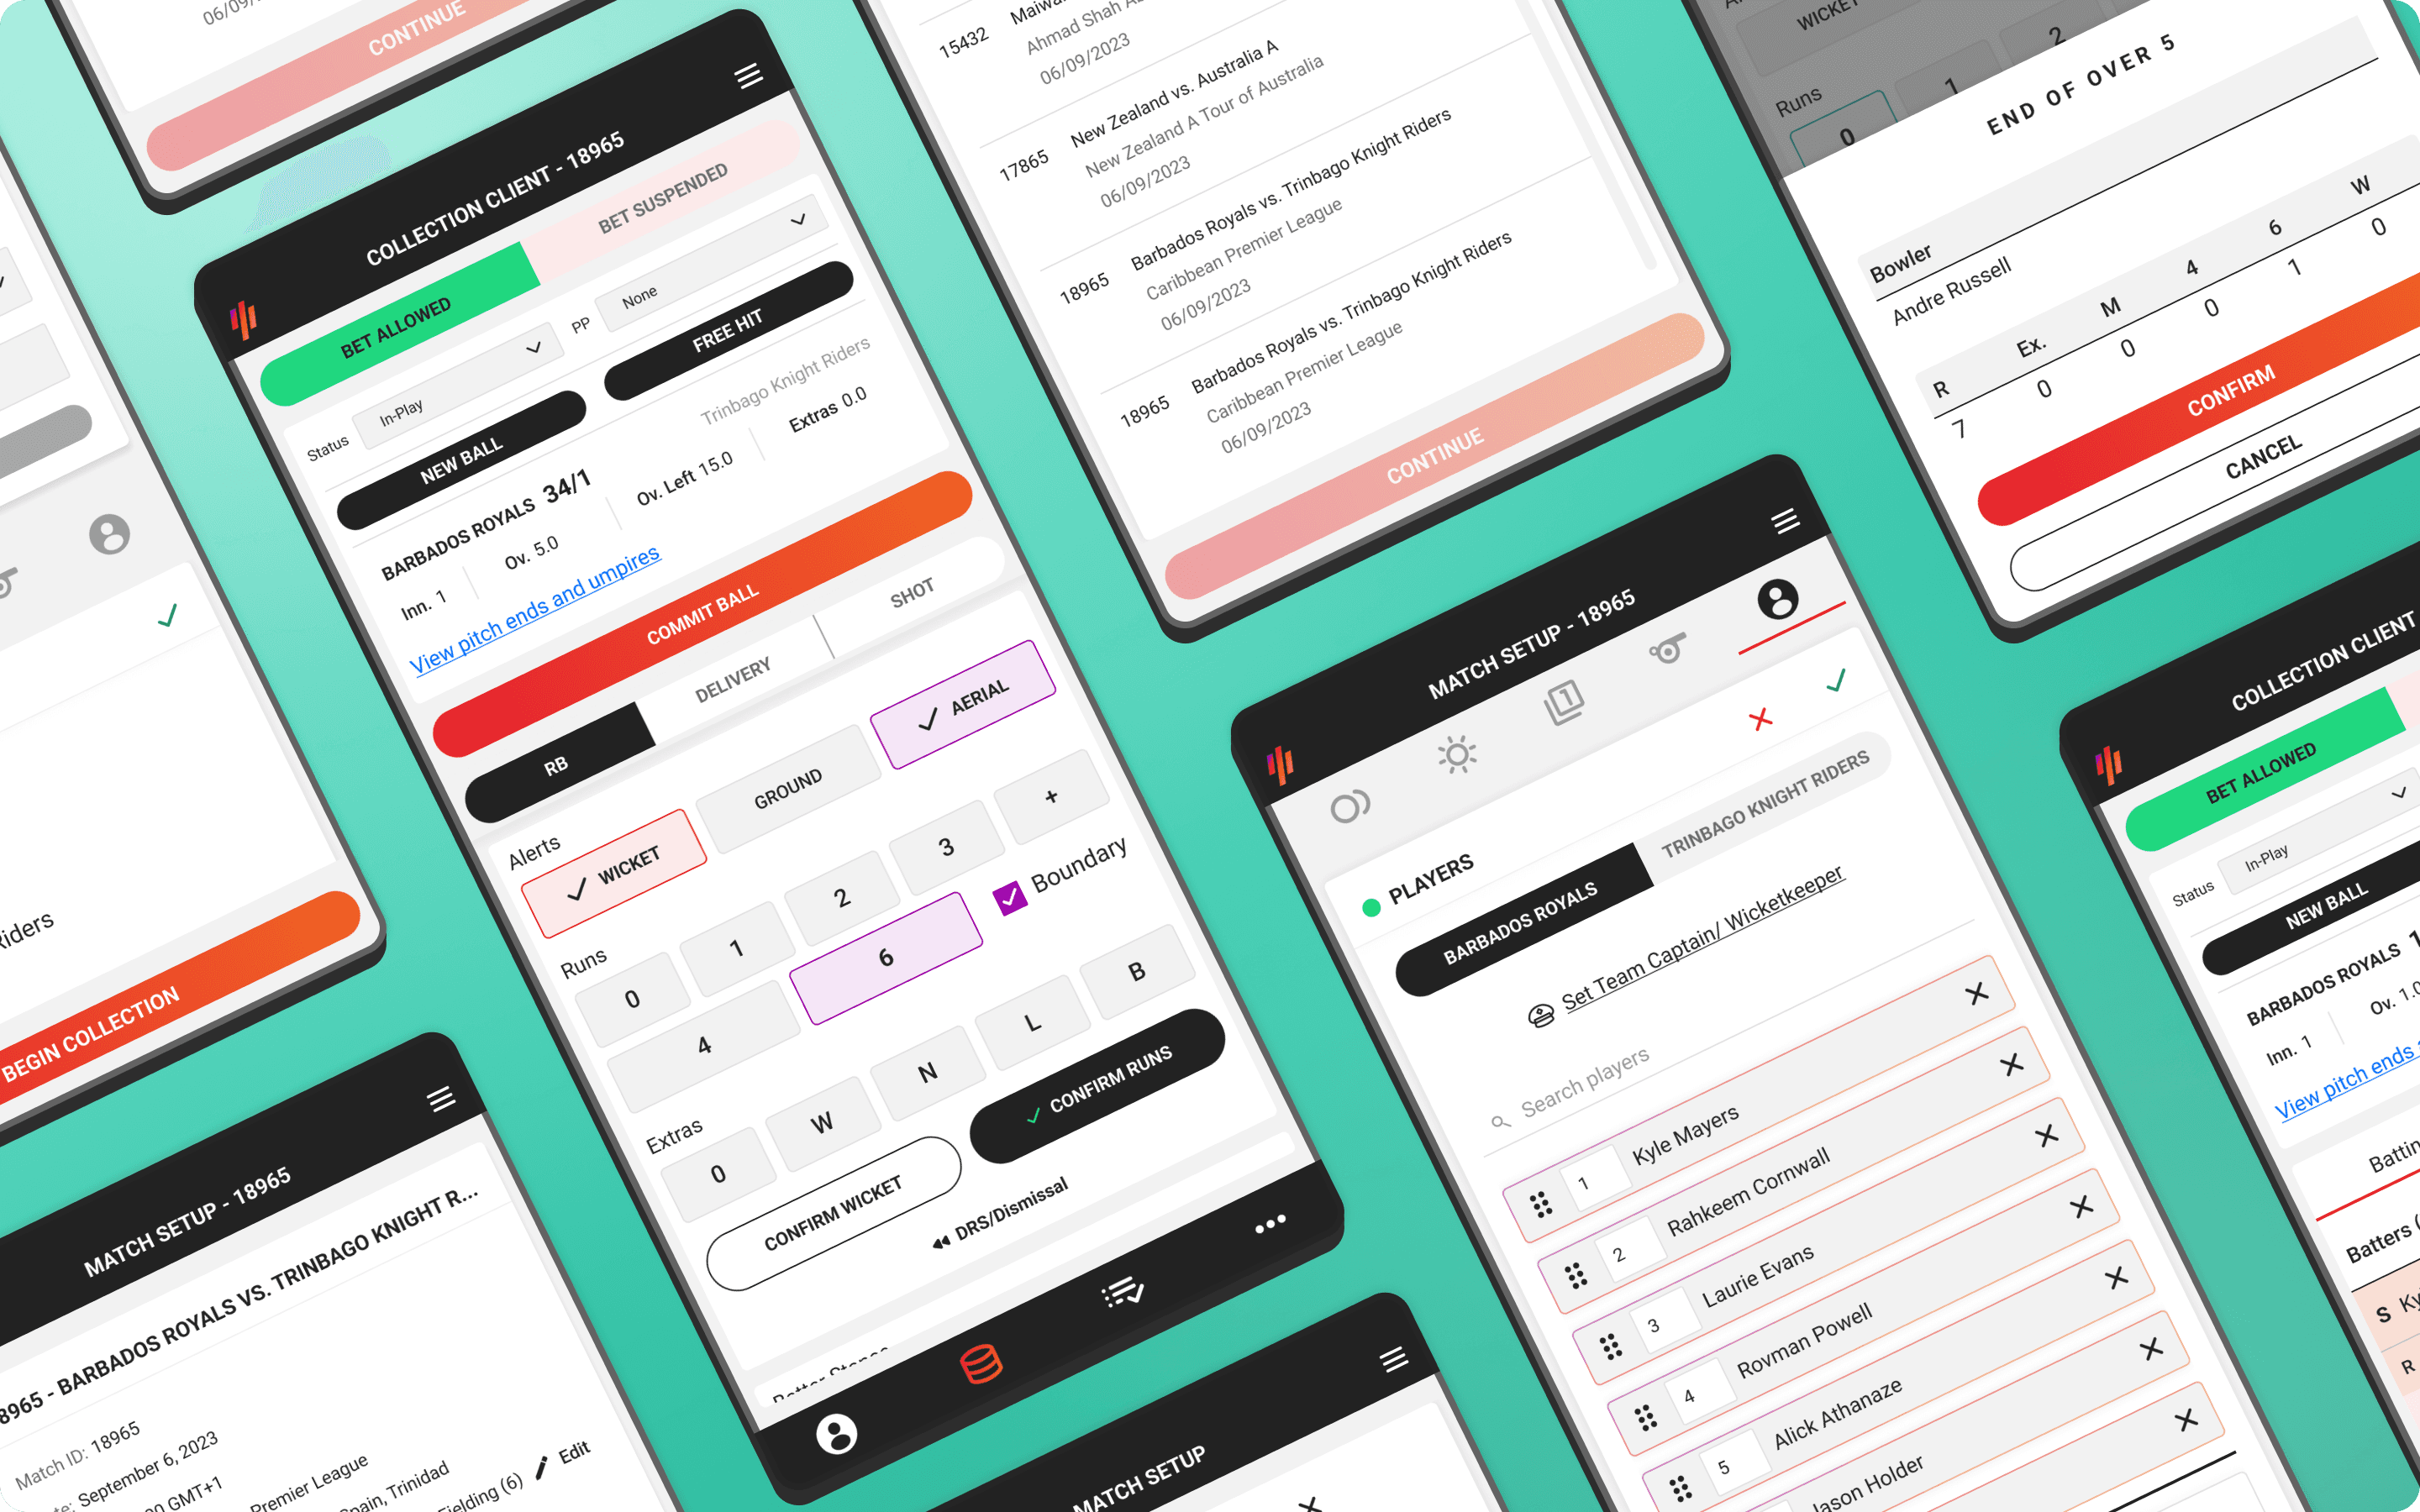
Brought in to design the UI from a developer prototype, testing revealed the interaction model couldn't keep pace with ball-by-ball collection. I proposed a single responsive client covering both mobile and desktop, eliminating the need for two separate tools and reducing long-term maintenance.

Proposed developer prototype.
30 Seconds Per Ball
I had never watched a cricket match in my life. Before I could assess whether the prototype worked, I needed to understand what it was asking analysts to do. I interviewed four cricket data operators and observed analysts as they set up matches and began collection.
The constraint that shaped everything was time. Between balls, analysts have 30 seconds or less to record the current delivery, maybe 45 if it's a boundary. Within that window they need to log fast data for live betting feeds first, then capture secondary performance data if time allows. Their eyes need to stay on the match as much as possible. Any interface that required them to hunt for inputs or disrupt their position on the page was going to cost them accuracy.
I also needed to understand the full scope of the collection process. At a high level it broke into three parts:
Match set-up
Data collection
Error correction & disconnections
In-ground analysts had a few additional steps to account for their physical presence at the stadium. I mapped these flows alongside data operators to lock in the happy path and begin identifying edge cases.
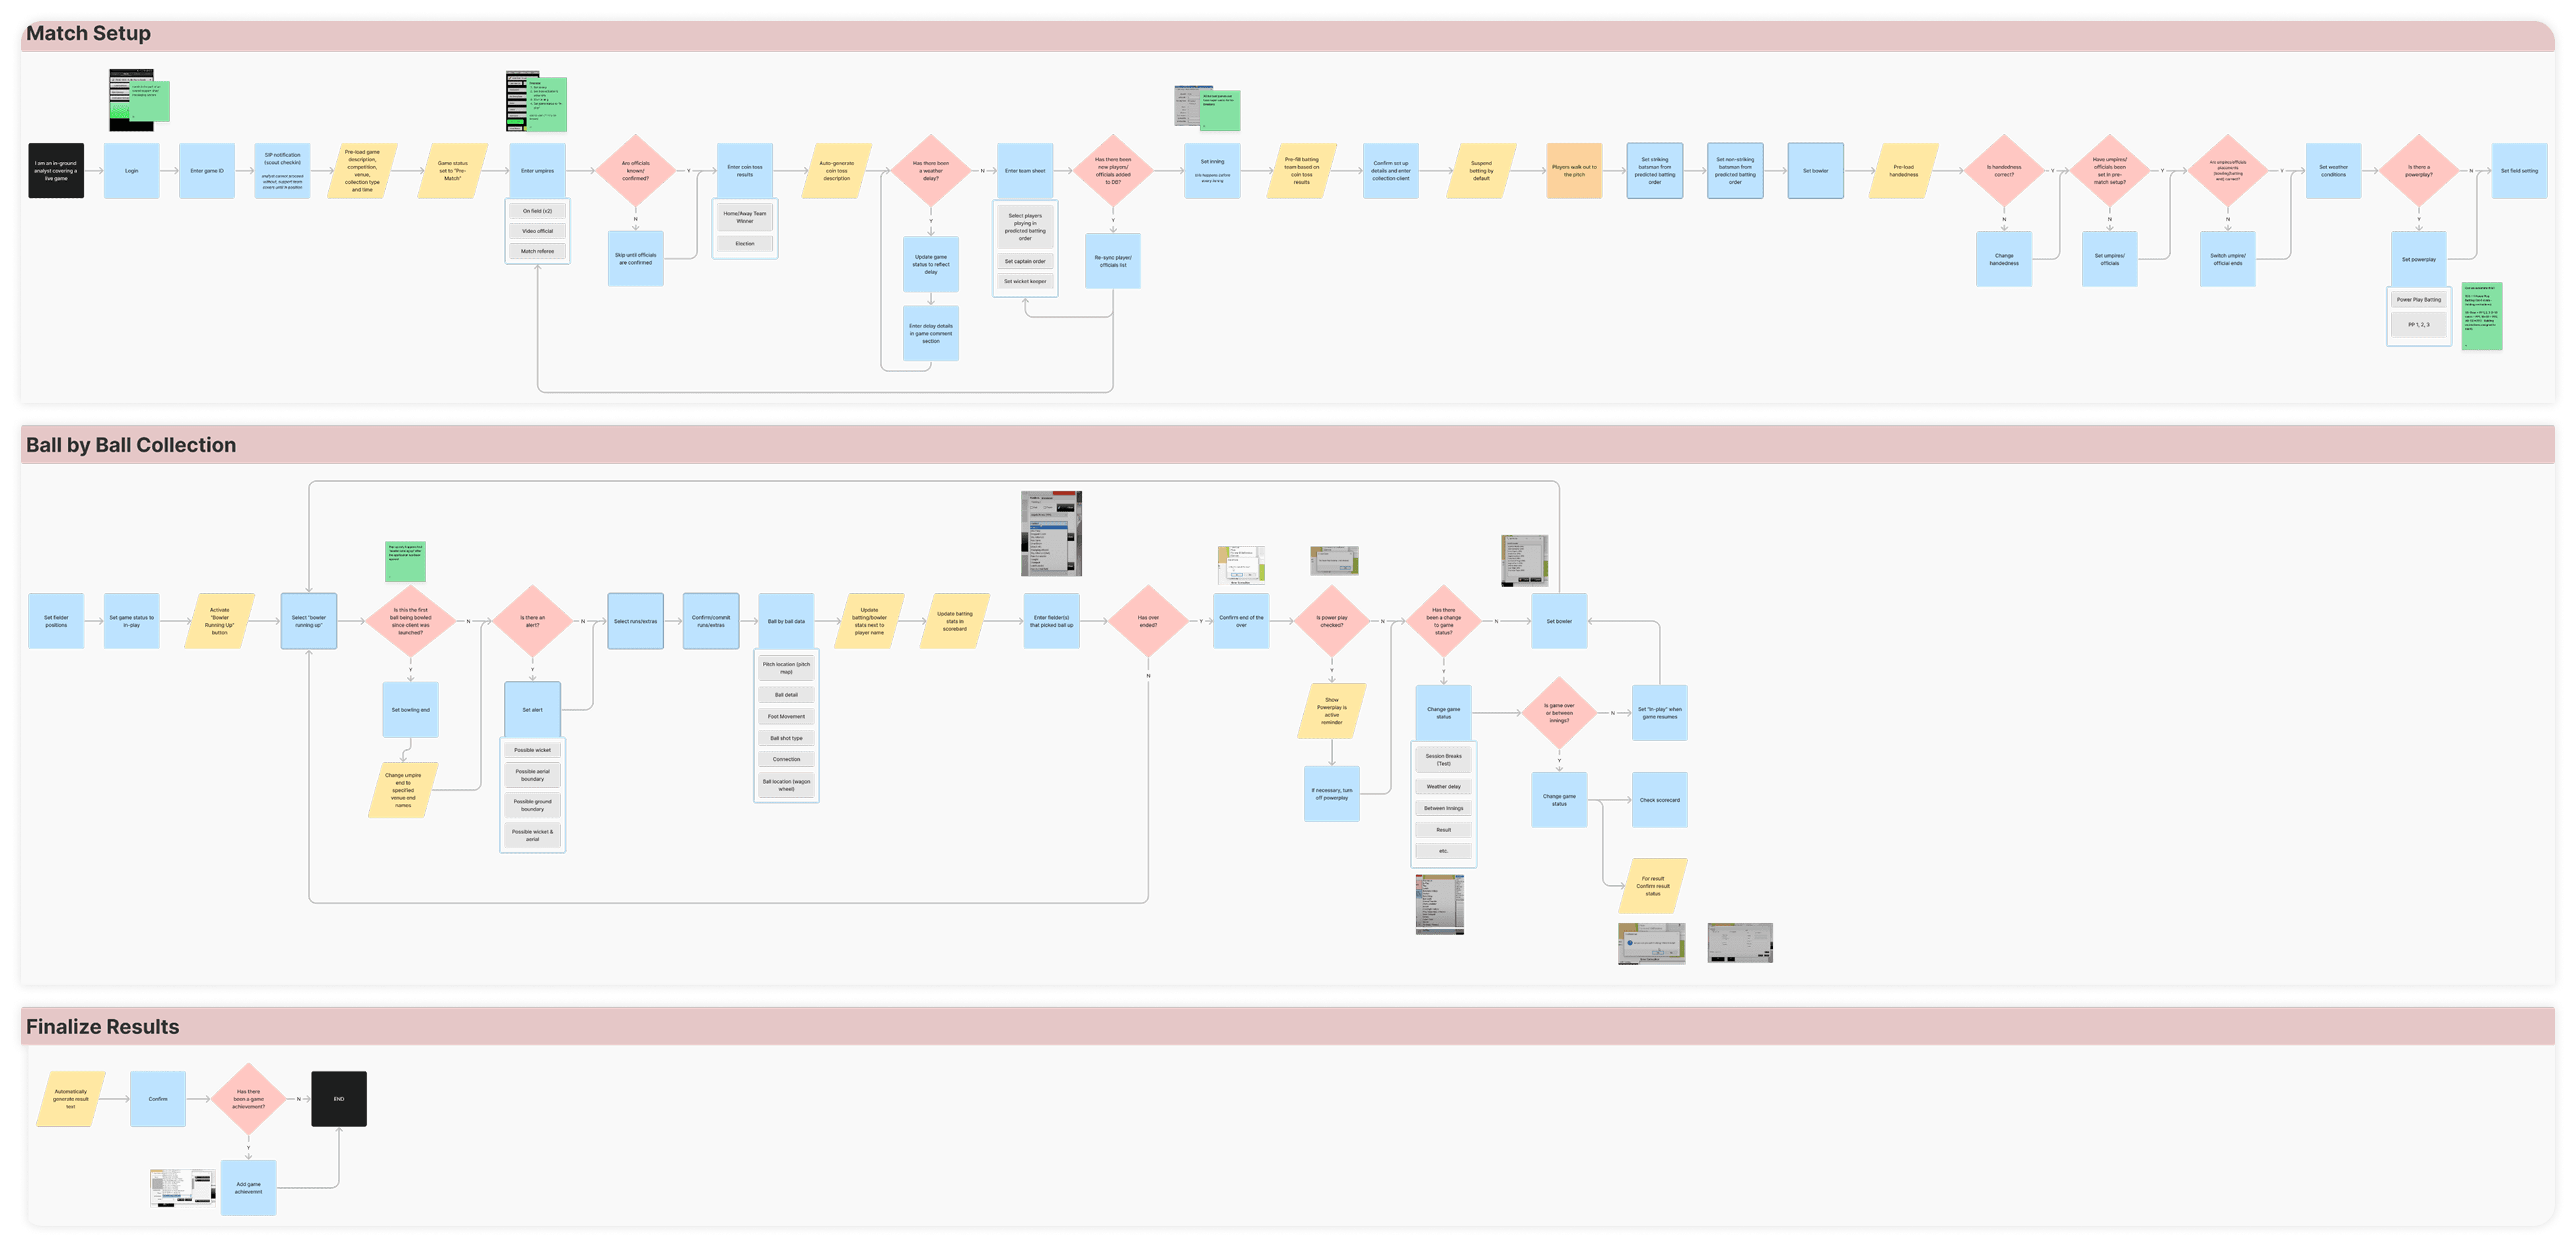
The existing tool was familiar to veteran analysts but posed real challenges for newer ones. It was cluttered, and common tasks like swapping the striking and non-striking batters were buried in dropdown menus that required analysts to navigate away from their current position in the interface.

A Prototype That Passed on Paper
The development team's proposed mobile prototype covered the data requirements. On that measure it did its job. But the feedback from analysts was immediate and consistent. The prototype had been built around what data needed to be captured, not how analysts actually collected it.
The mental models these analysts had developed over years of using the existing tool, however imperfect, were not reflected anywhere in the new design. If shipped as-is, it would have inhibited their process rather than improved it.

Cricket Executive & Former Analyst
Stats Perform
"There are a lot of pegs trying to be fit into square holes that don't work. It's a complicated interface and process. It's a bit mixed as to what is done in what order and what priority is for what."

Cricket & Operations Manager ANZ & Former Analyst
Stats Perform
"I saw an early prototype and there's a lot of problems. It's clunkier than the desktop version and will make it more difficult to collect. The operators should be able to keep their eyes on the game at all times."
I presented these findings to the Senior Project Manager, Engineering Manager, and Product Owner. The decision was made to abandon the proposed design and pivot to building a new responsive client from scratch. If successful, it would serve as a model for data collection tools across other sports at Stats Perform.
How might we simplify the collection process so operators can collect both betting and media data within a single application, whether in the office or on the field, without compromising speed or accuracy?

Review, Collect, Troubleshoot
Rather than building a separate mobile app, I proposed a responsive desktop client that would provide a consistent experience across all environments: in the office, on a laptop, and on mobile in the field. One tool, one mental model, one codebase.
With edge cases still being defined throughout the project and a design system that only accounted for desktop components, I used mobile wireframes as the primary working tool early on. It allowed me focus on functionality and information architecture first, and gave subject matter experts something concrete to react to without getting distracted by visual design decisions.

The information architecture went through many revisions during usability testing. My initial approach divided fast data and performance inputs into separate tabs on mobile, giving analysts the ability to skip performance data when time was short.
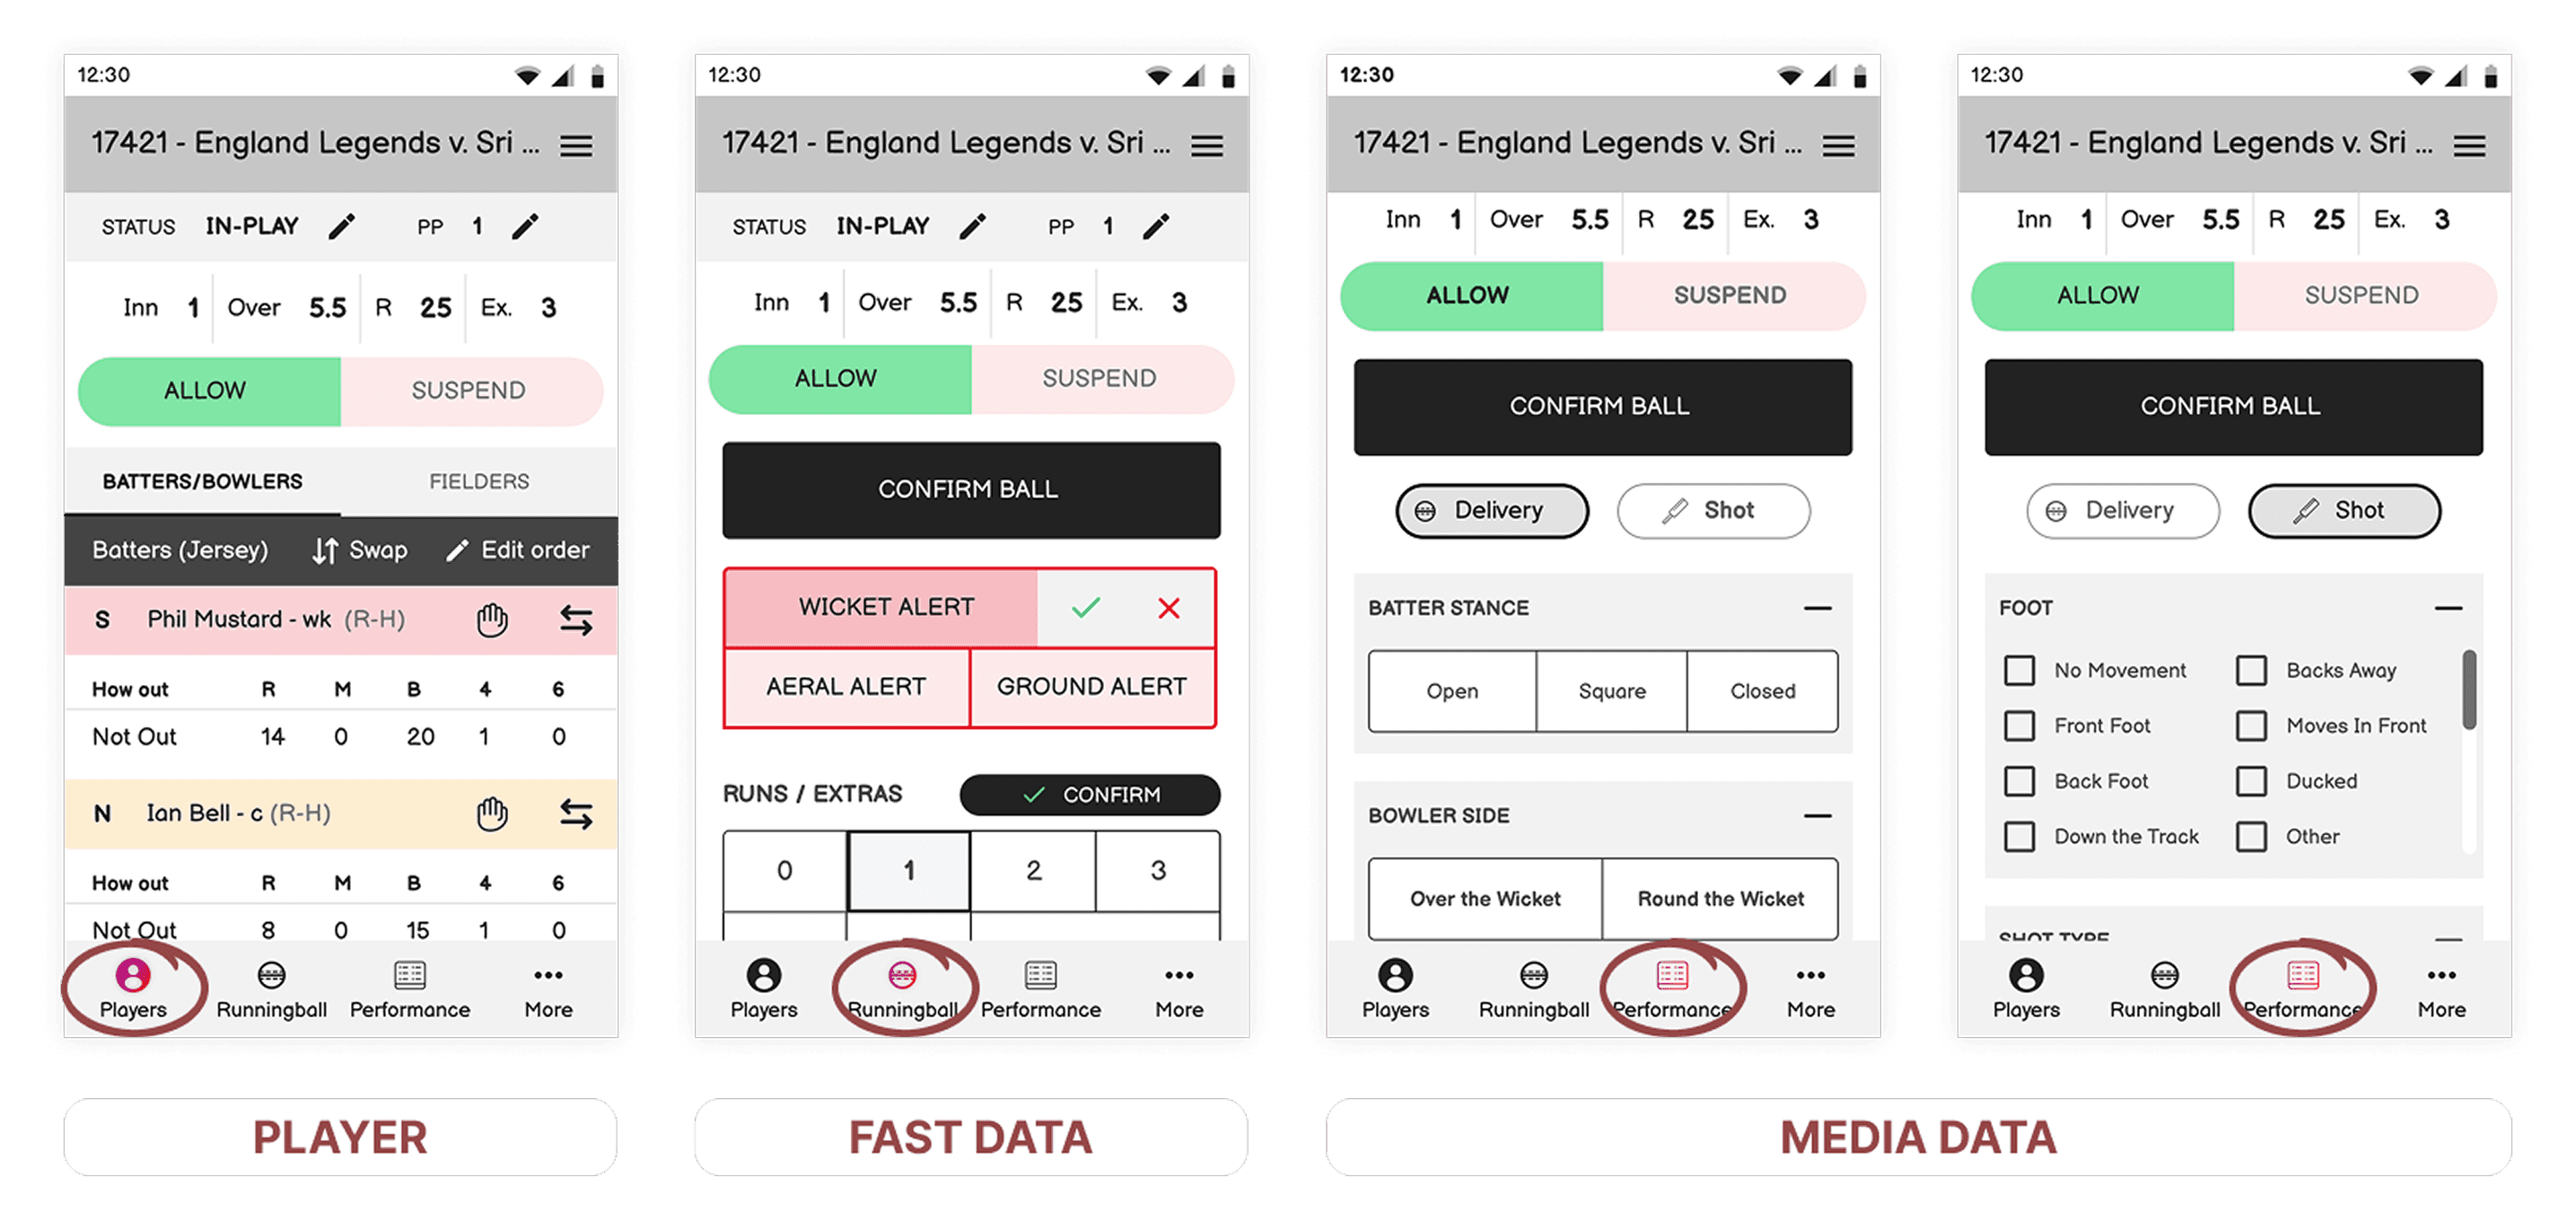
Testing showed the opposite worked better: a continuous scrollable list that analysts could move through at their own pace, checking off inputs as time allowed, was faster and more natural than switching between tabs.
Taking a step back, I reorganised the navigation around the three stages that actually defined the analyst's experience during a match:
Review
Collect
Troubleshoot
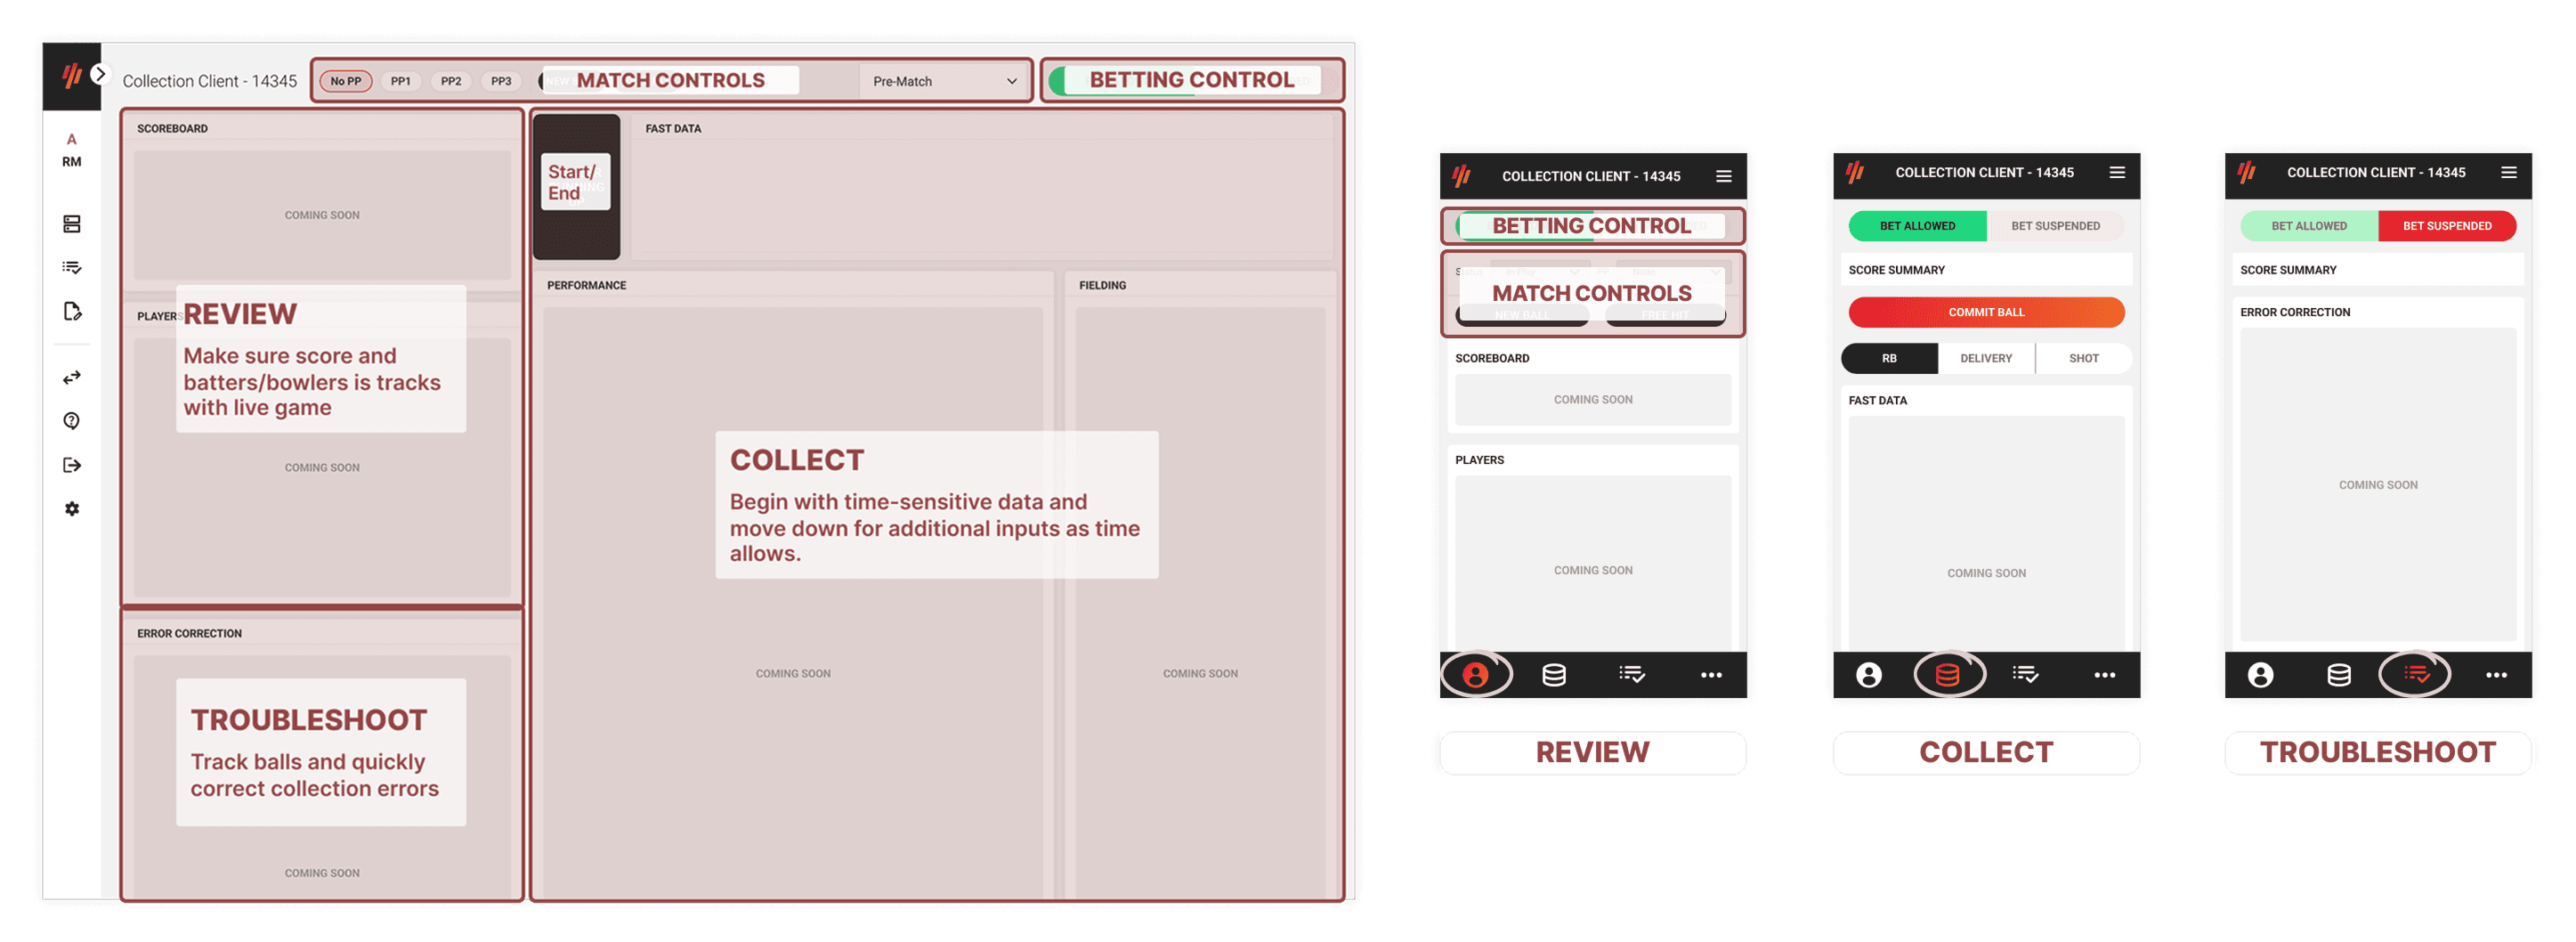
General match and betting controls sat at the top, accessible at any point. Additional features not directly tied to active collection were kept out of the main flow.
For scroll navigation within collection, I tested different placements for an anchor menu and landed on fixing the collection nav bar above the inputs as analysts scrolled. This let them jump between input sections quickly without losing their place, and kept it decoupled from the confirmation button so analysts couldn't accidentally commit a ball without completing fast data first. If they tried, they were prompted to confirm their intention.

Fast data inputs were positioned adjacent to the primary commit button, "Bowler Running Up / Commit Ball," keeping the most time-critical part of the interface contained and reducing the need to scroll for the most common action.

Input types were grouped into action cards, with relevant controls embedded within each card rather than sitting in a toolbar above the table. Mobile and desktop components were delivered one action card per two-week sprint, which let the development team begin building immediately while design continued defining the remaining requirements.


Learning the Sport to Design for It
The biggest process challenge on this project was not the interface. It was the gap between two data operations teams, performance and fast data, spread across three continents, who believed they were aligned but held different expectations about what the tool needed to do. Bridging that gap required ongoing stakeholder management alongside the design work.
Cricket also presented a domain knowledge problem. The sport looks simple but carries a significant amount of edge-case complexity. Rules, exceptions to rules, and format variations across leagues. Getting the collection flow right meant understanding which exceptions needed to be accounted for in the interface, even if they occurred rarely.
I watched matches, shadowed analysts, and worked through requirements iteratively with subject matter experts to build that knowledge in parallel with the design.
At the time, design at Stats Perform was still working to move upstream in the product development process. The product team's willingness to let me test and challenge the proposed solution before committing to it was significant, both for this project and for the broader credibility of continuous research and iterations.
The decision to pivot based on research findings rather than sunk cost was not a given, and it made the difference between a tool analysts could naturally use and one they would have to retrofit their process into.

Outcome
The proposed design received 100% approval from five analysts tested across multiple usability sessions, and I received stakeholder approval to use the responsive client model as a blueprint for data collection tooling across multiple sports at Stats Perform.
I led the project for the first eight weeks before handing over to Reeshma Kumar upon my resignation in November 2023.