B2B SaaS
Opta Search
A single platform replacing three legacy tools. Four new clients signed pre-launch and a 20% reduction in manual help desk load through self-service.
Category
Product Design
Client
Stats Perform
Year
2023

Project overview
When live sports disappeared in 2020, sports media companies turned to historical data to keep content flowing. It emphasized the value of Stats Perform's wealth of data going back to 1876, provided by three separate legacy platforms with interfaces largely unchanged since the late 1990s. Following its acquisition of Perform in 2019, Stats Perform inherited Opta's overlapping tools, which contributed to fragmented workflows.
As part of the Opta Fan Engagement product suite (previously PressBox), the business wanted a single, modern research platform to support the full cycle of sports journalism, from pre-match preparation through to post-match reporting.
I co-led product design on Opta Search from discovery through to launch, covering research, requirements, UX/UI design, usability testing, and implementation.
Stats Perform's three disparate legacy tools.
The story behind the story
There were no usage analytics, no prior research, and no clear picture of what a sports researcher's day actually looked like.
What does the complete research process entail from beginning to end?
I began by:
Interviewing 21 statisticians, editors, producers, and researchers across four sports and five regions
Auditing 100s of help desk emails to understand the patterns in what clients were asking for and couldn't find themselves
Running a competitive analysis on the third-party tools clients were using to fill the gaps
Auditing all three legacy platforms
Three patterns emerged that shaped everything that followed.
All researchers always started broad and narrowed down. They were not looking for a specific stat so much as following a thread, refining their query as something caught their eye. The platform needed to support that exploratory mode first, with advanced search available when they had a specific question in mind.
All workflows revolved around match timing. The questions researchers asked before, during, and after a match were fundamentally different. The platform needed to reflect that rhythm.
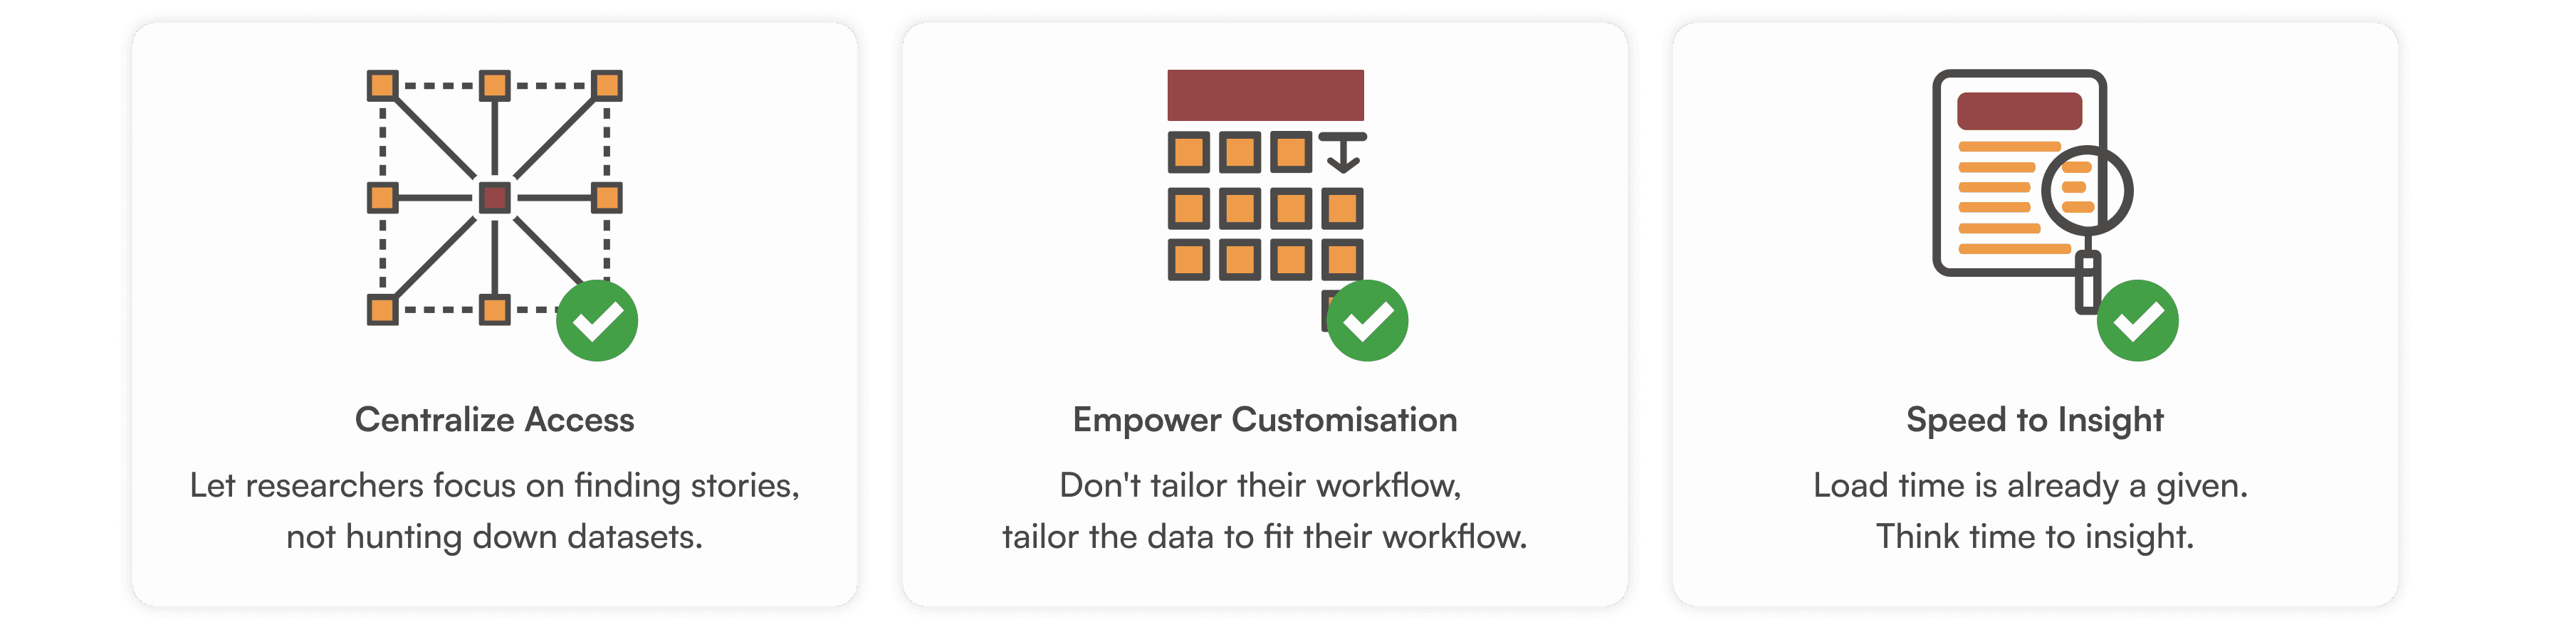
Context was the product. Stats and records only had editorial value when researchers could compare them, track streaks, and understand what made a number meaningful. The platform needed to break the rigidity of their predecessors's static data tables to allow for comparison, customization and contextualization.

Senior Researcher
NFL Network
"The closest thing that I can compare it to is, if we went to a restaurant, StatsPass has some good things, but what's on the menu is what you can order and that's what you get. If you need this specific thing and StatsPass has it, you know it's going to be good. It's reliable, and you can use it. If you need no cheese on your burger, you might be screwed."

We ran and synthesized 21 user interviews, reviewed 100s of help desk inquiries, audited three legacy sites and conducted competitor analysis on third-party tools used by clients.
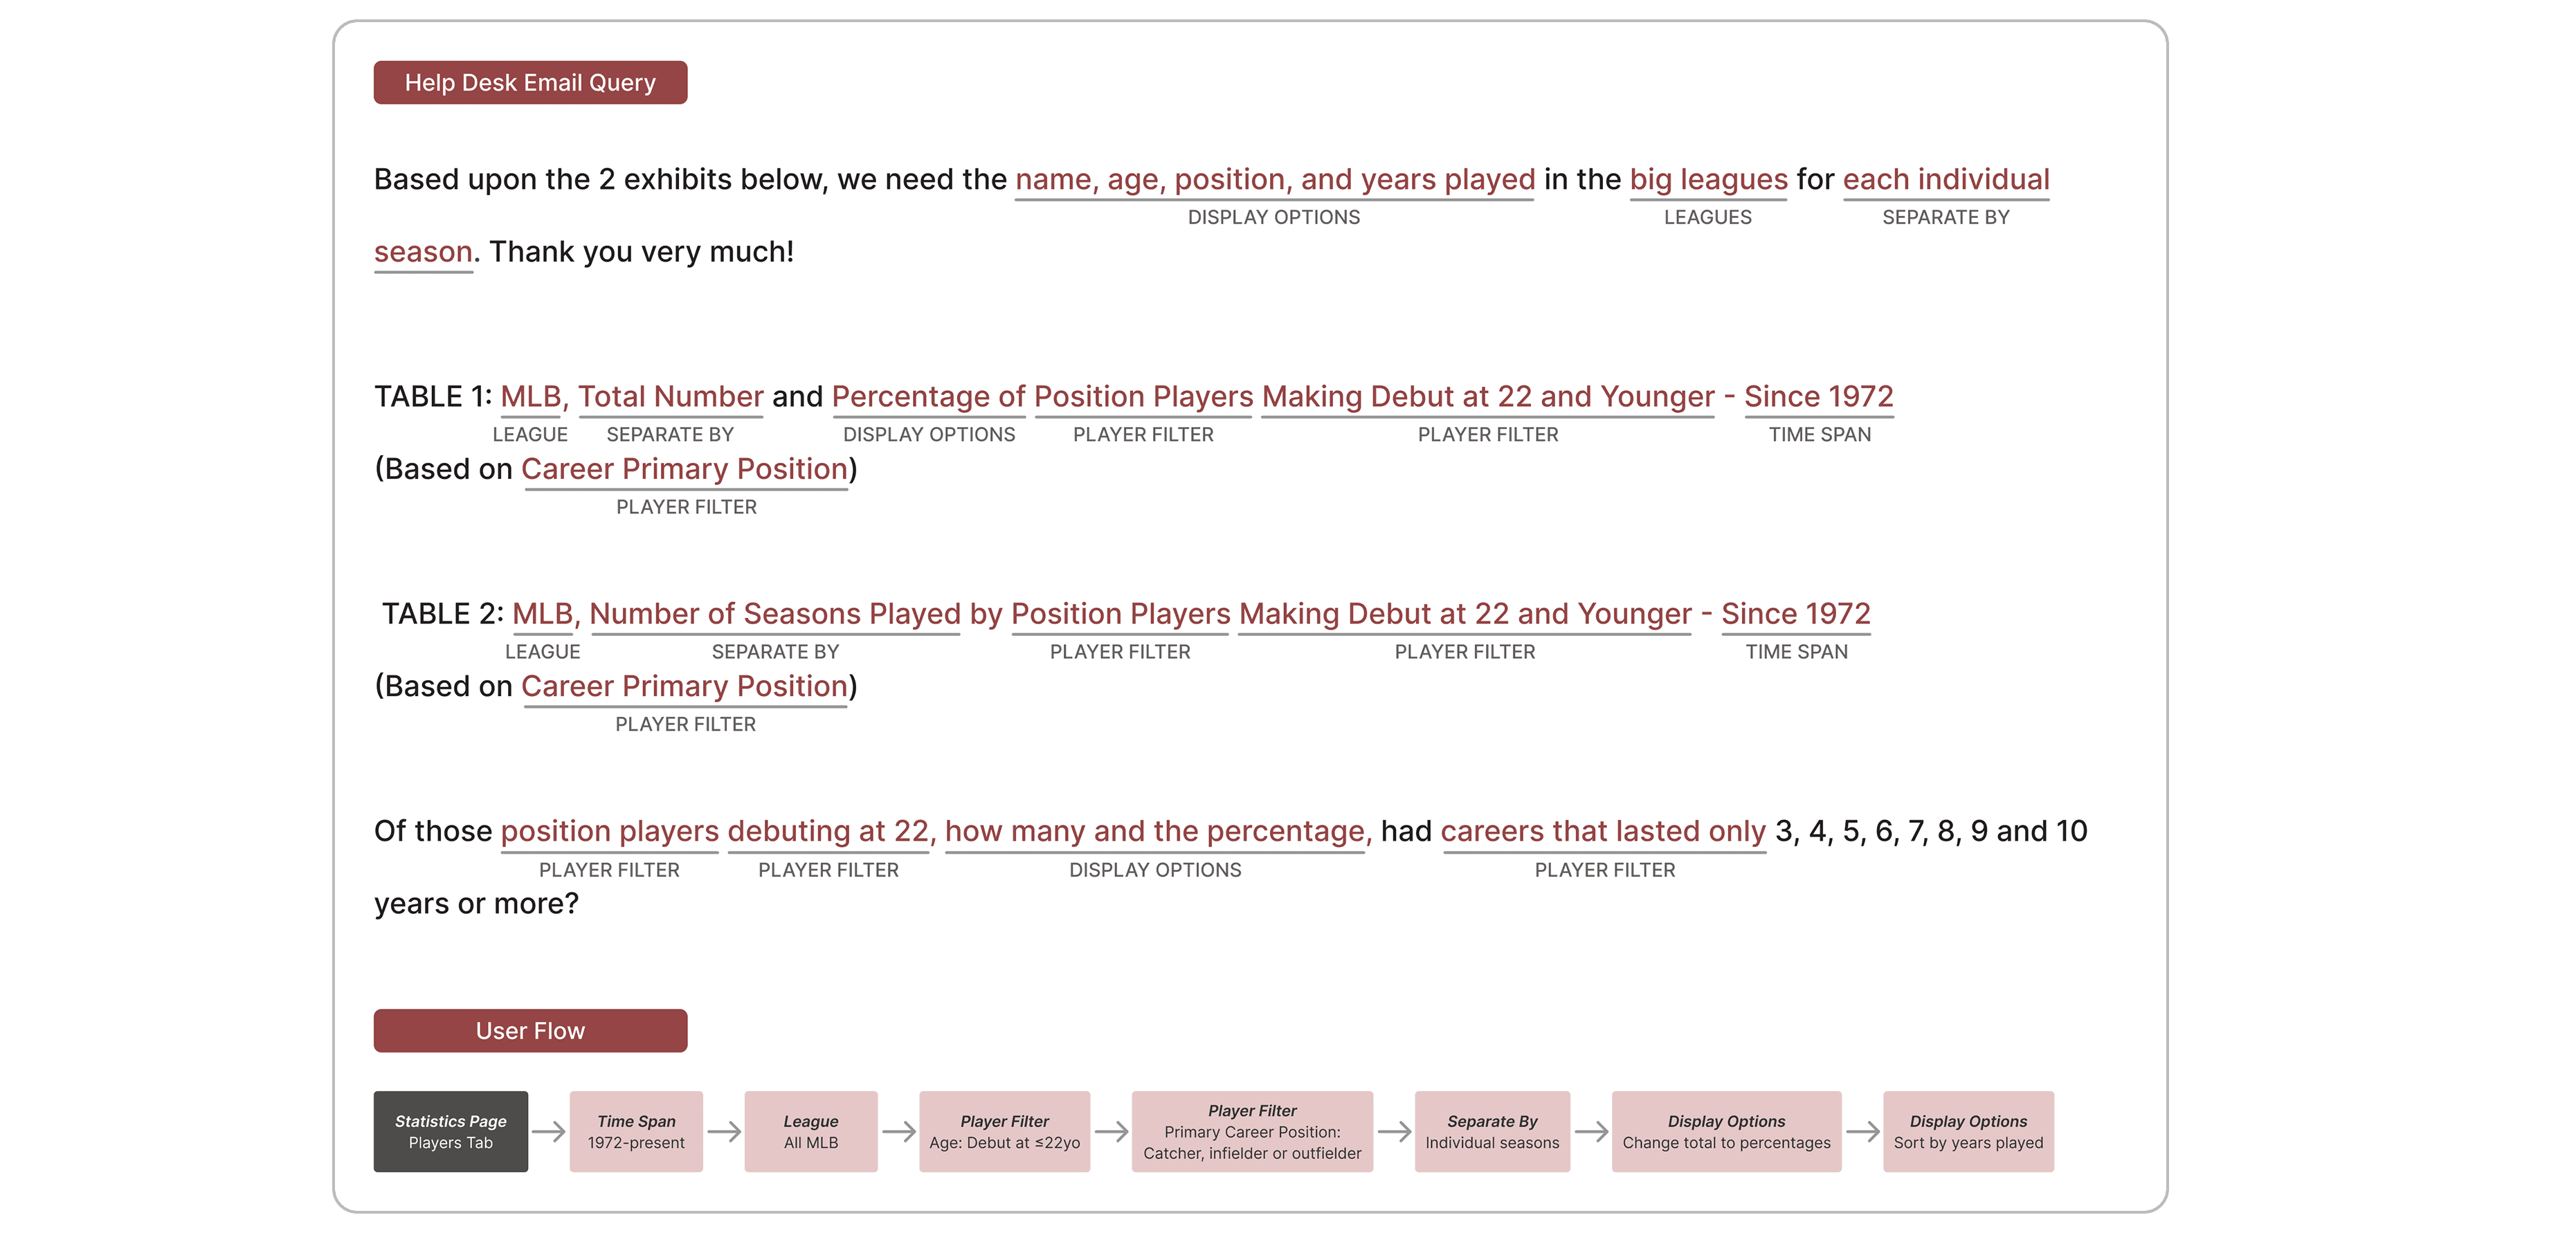
The Help Desk Was the Product
The research revealed that Stats Perform's editorial help desk wasn't just a support function, it was a workaround. Clients supplemented Stats Perform's legacy tools with third-party tools and routed up to 160 requests per event through the help desk.
Clients were dependent on other methods not because they lacked capability, but because Stats Perform's tools didn't give them a path to self-serve. They couldn't customise tables, couldn't access all historical databases in one place, and couldn't build the contextual comparisons that was the bread and butter of their reporting.
The original brief was to design a single search tool. Our research reframed the problem space and redefined the scope.
How might we help researchers uncover new story angles and gather contextual evidence quickly enough to compile and share insights with their broadcast and digital media teams to meet their deadlines?
Designed for the Thread, Not the Answer
Opta Search was structured around the natural arc of the research process rather than the architecture of the legacy tools it replaced.
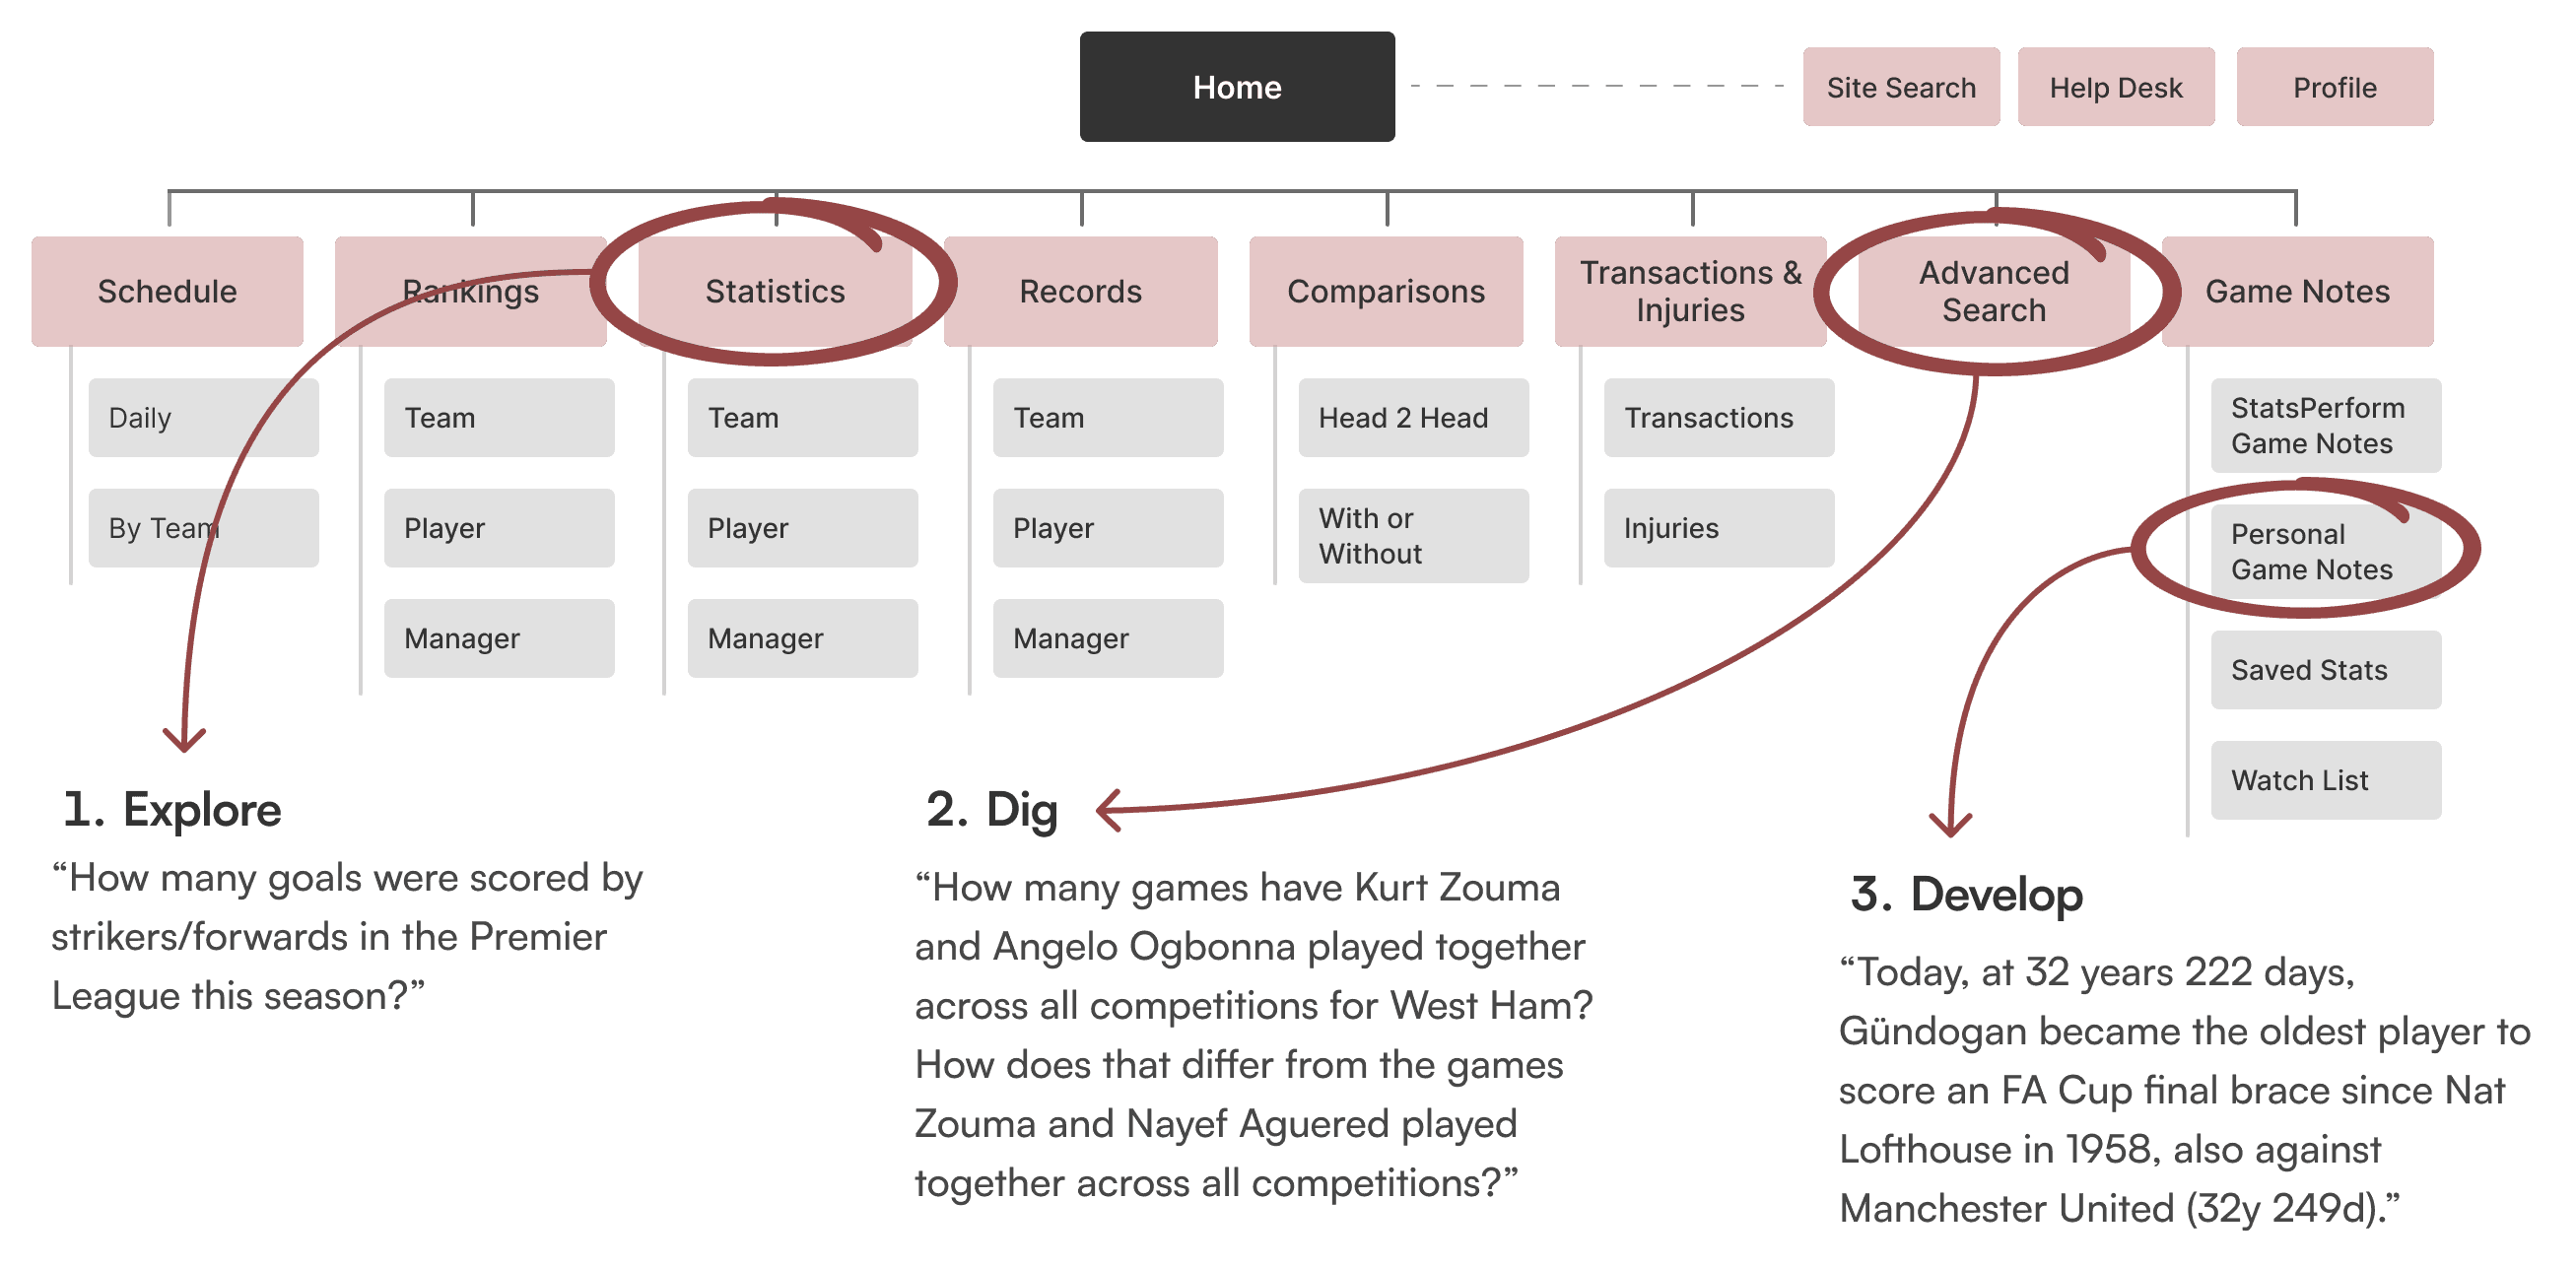
Statistics served as the homepage, supporting the open-ended exploration that started every researcher's process. View By and Templates were surfaced upfront so researchers could quickly shift between groupings and spot anomalies without digging through menus. Primary filters for league, date, and teams were anchored at the top at all times so researchers covering multiple fixtures simultaneously always knew what dataset they were looking at.
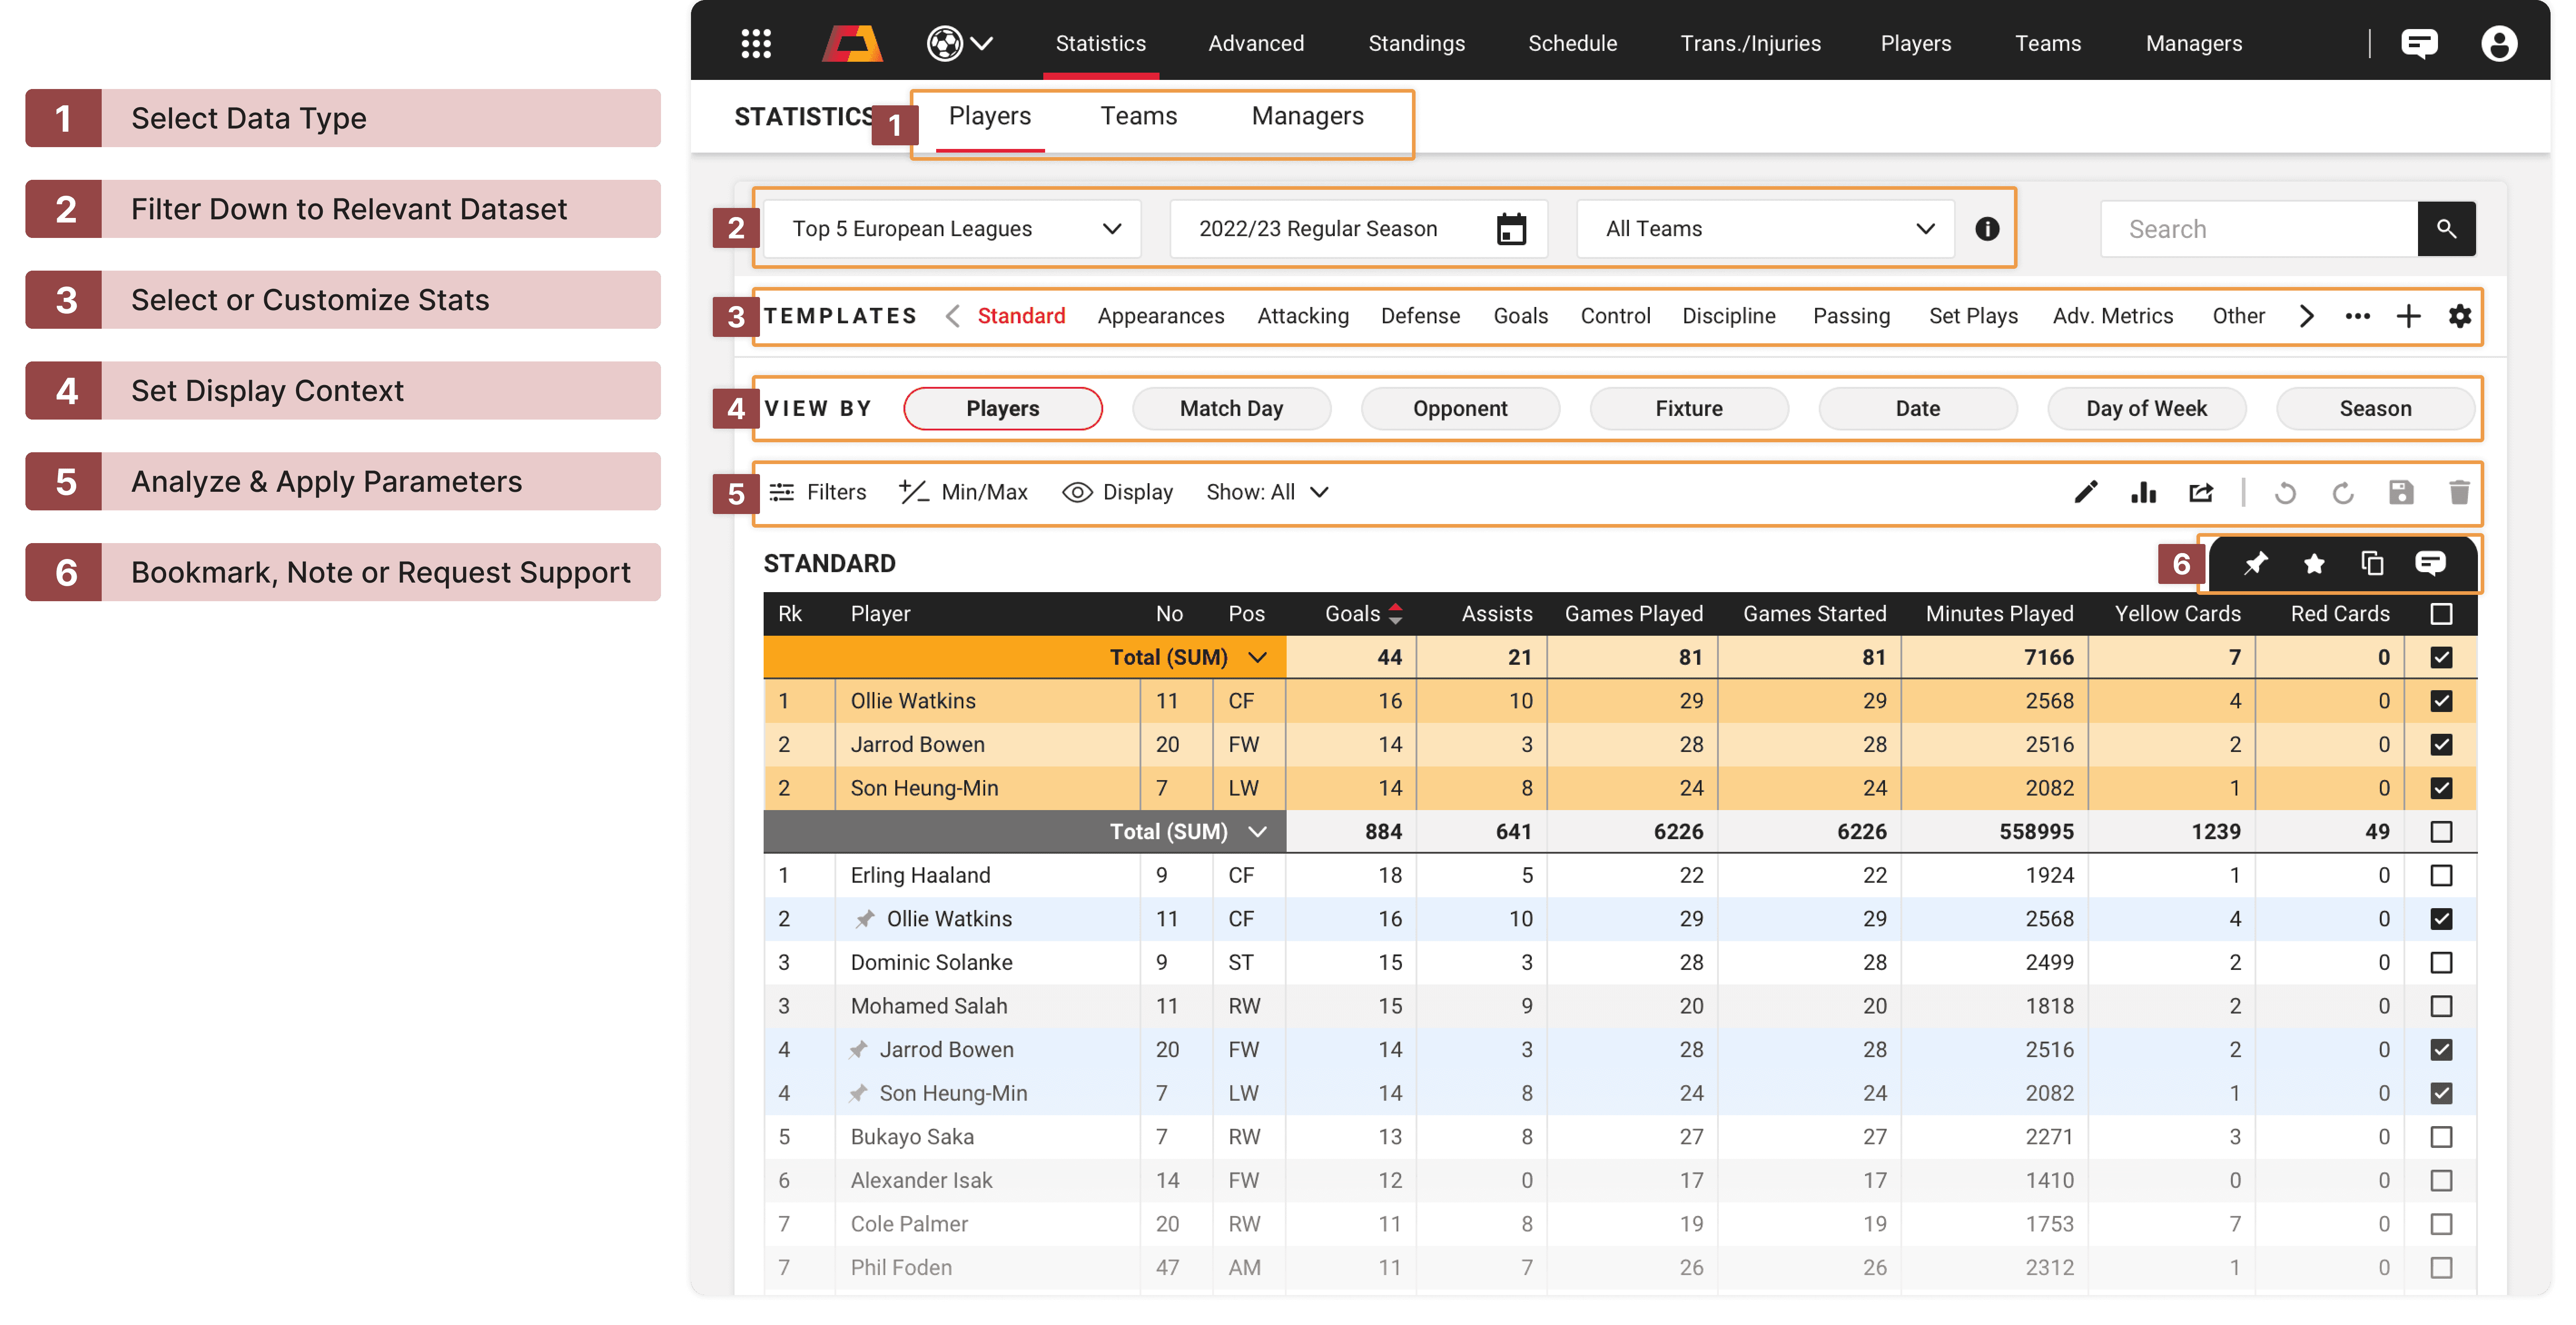
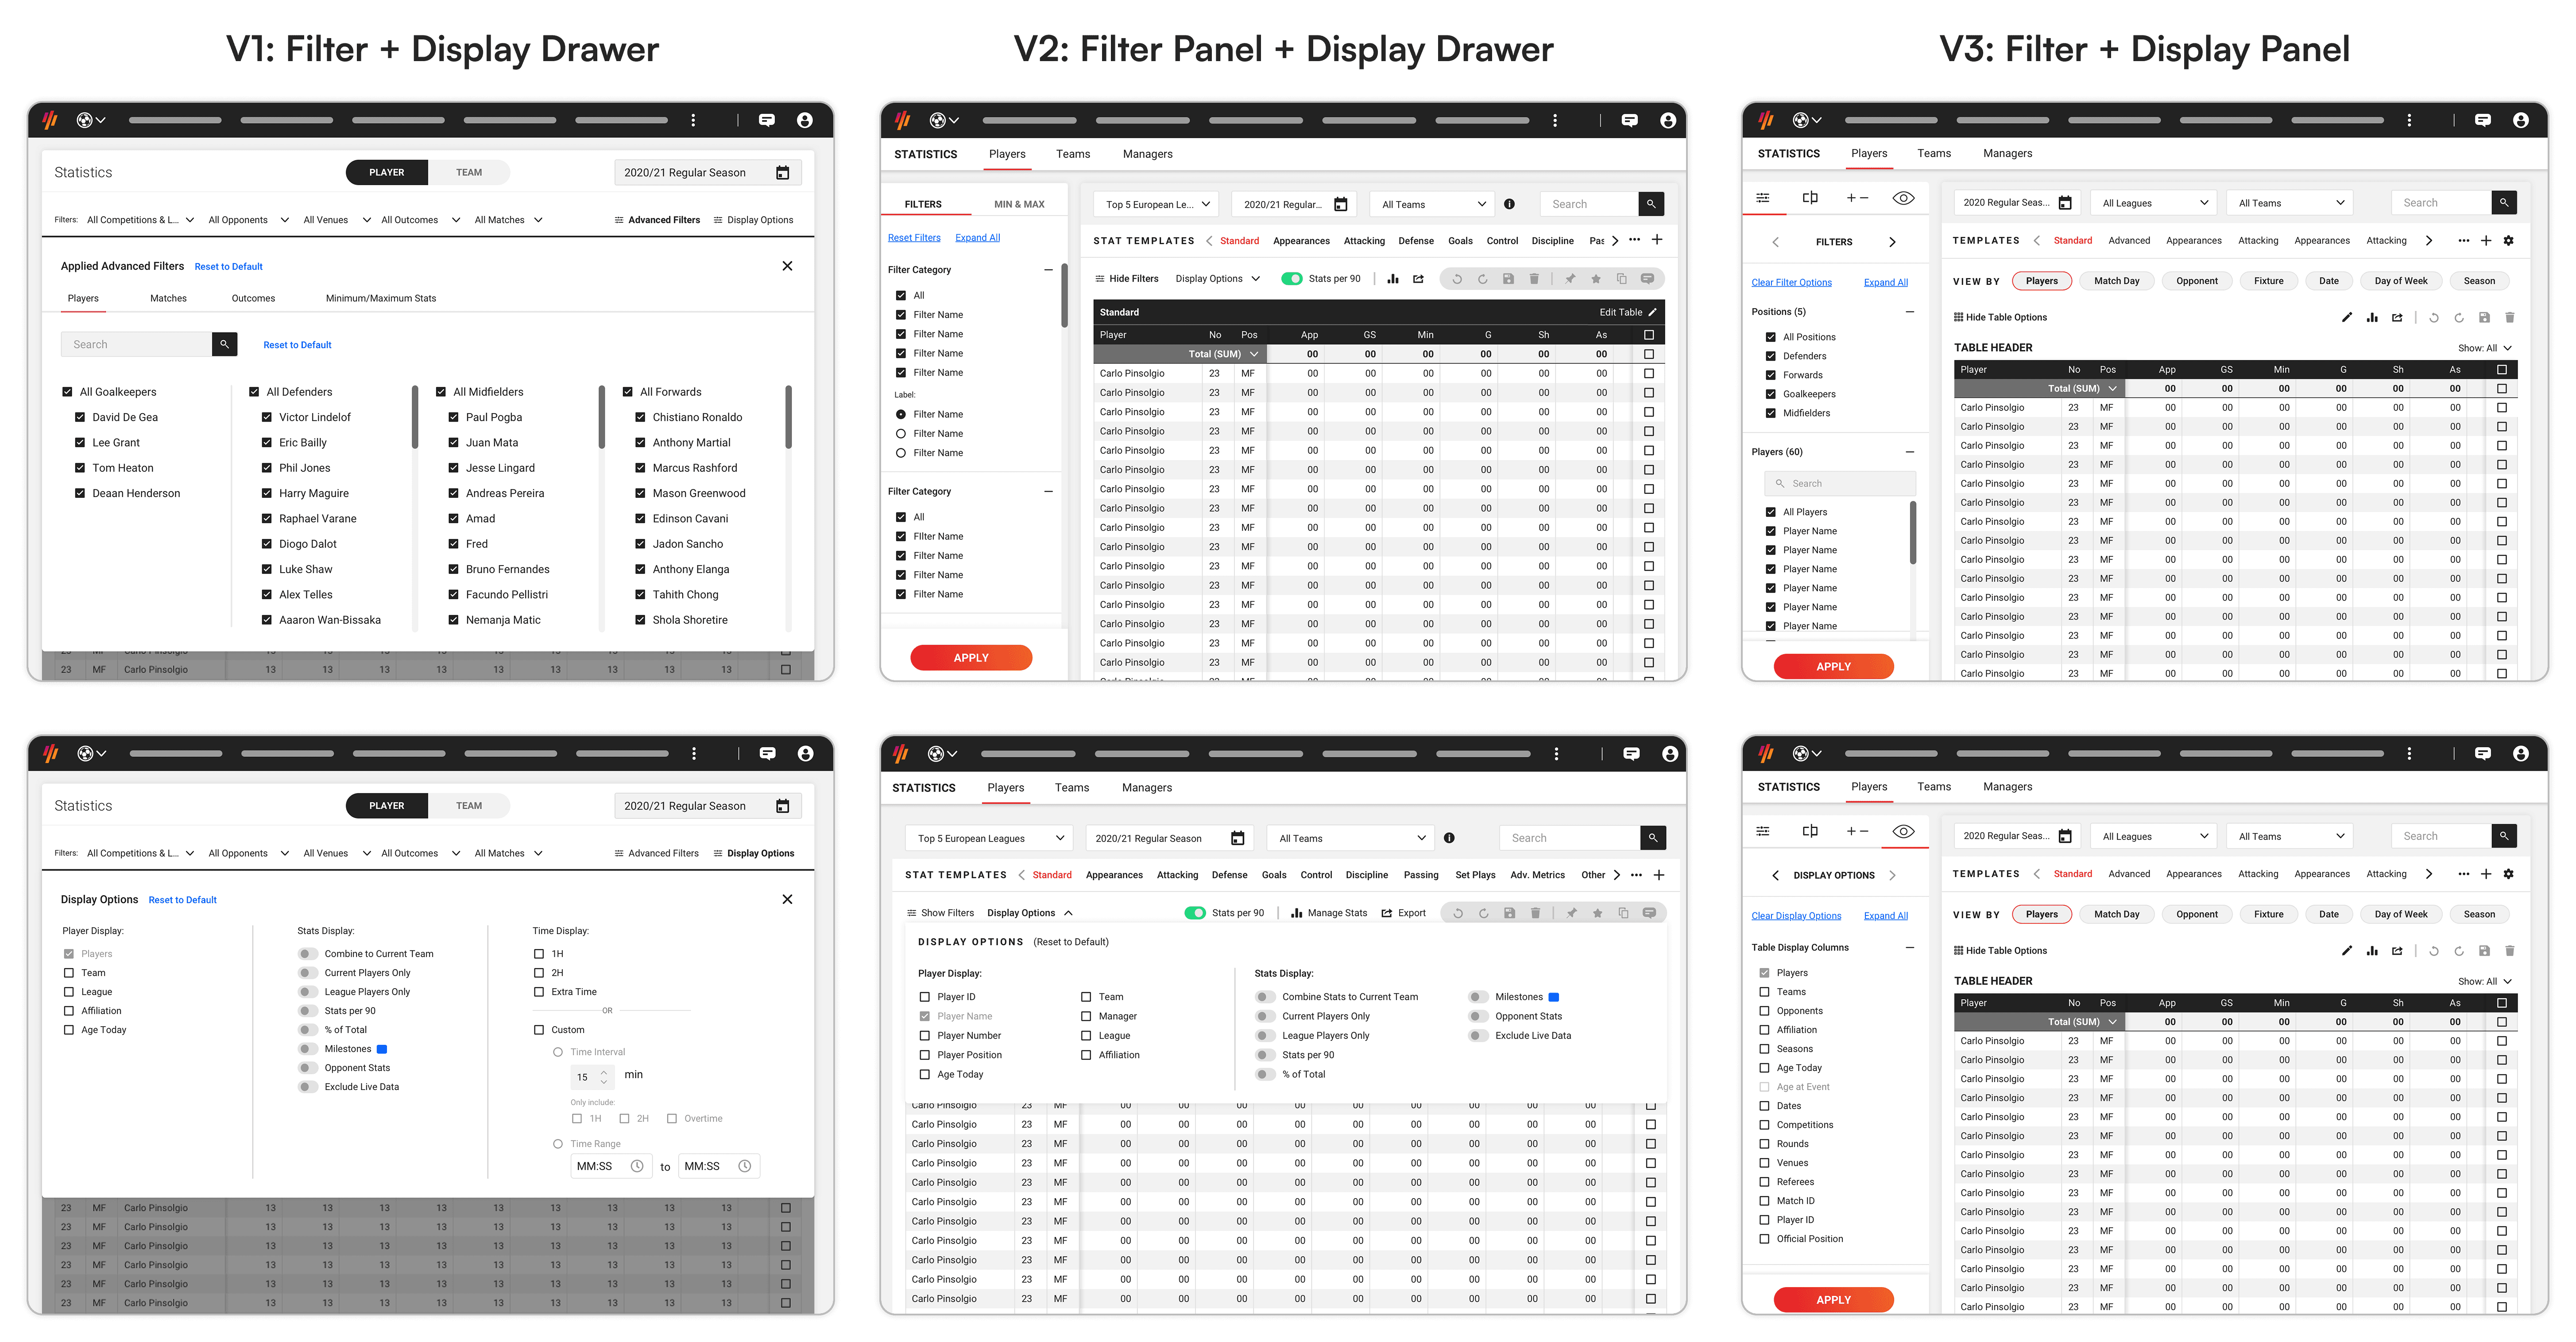
After usability testing, filters and display options were moved into a consolidated side panel rather than sitting above the table. This let researchers see the data update in real time as they refined their query, which in itself could surface something worth investigating.
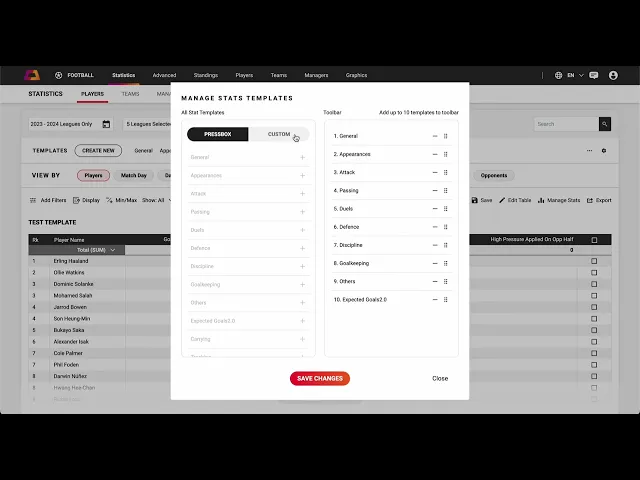
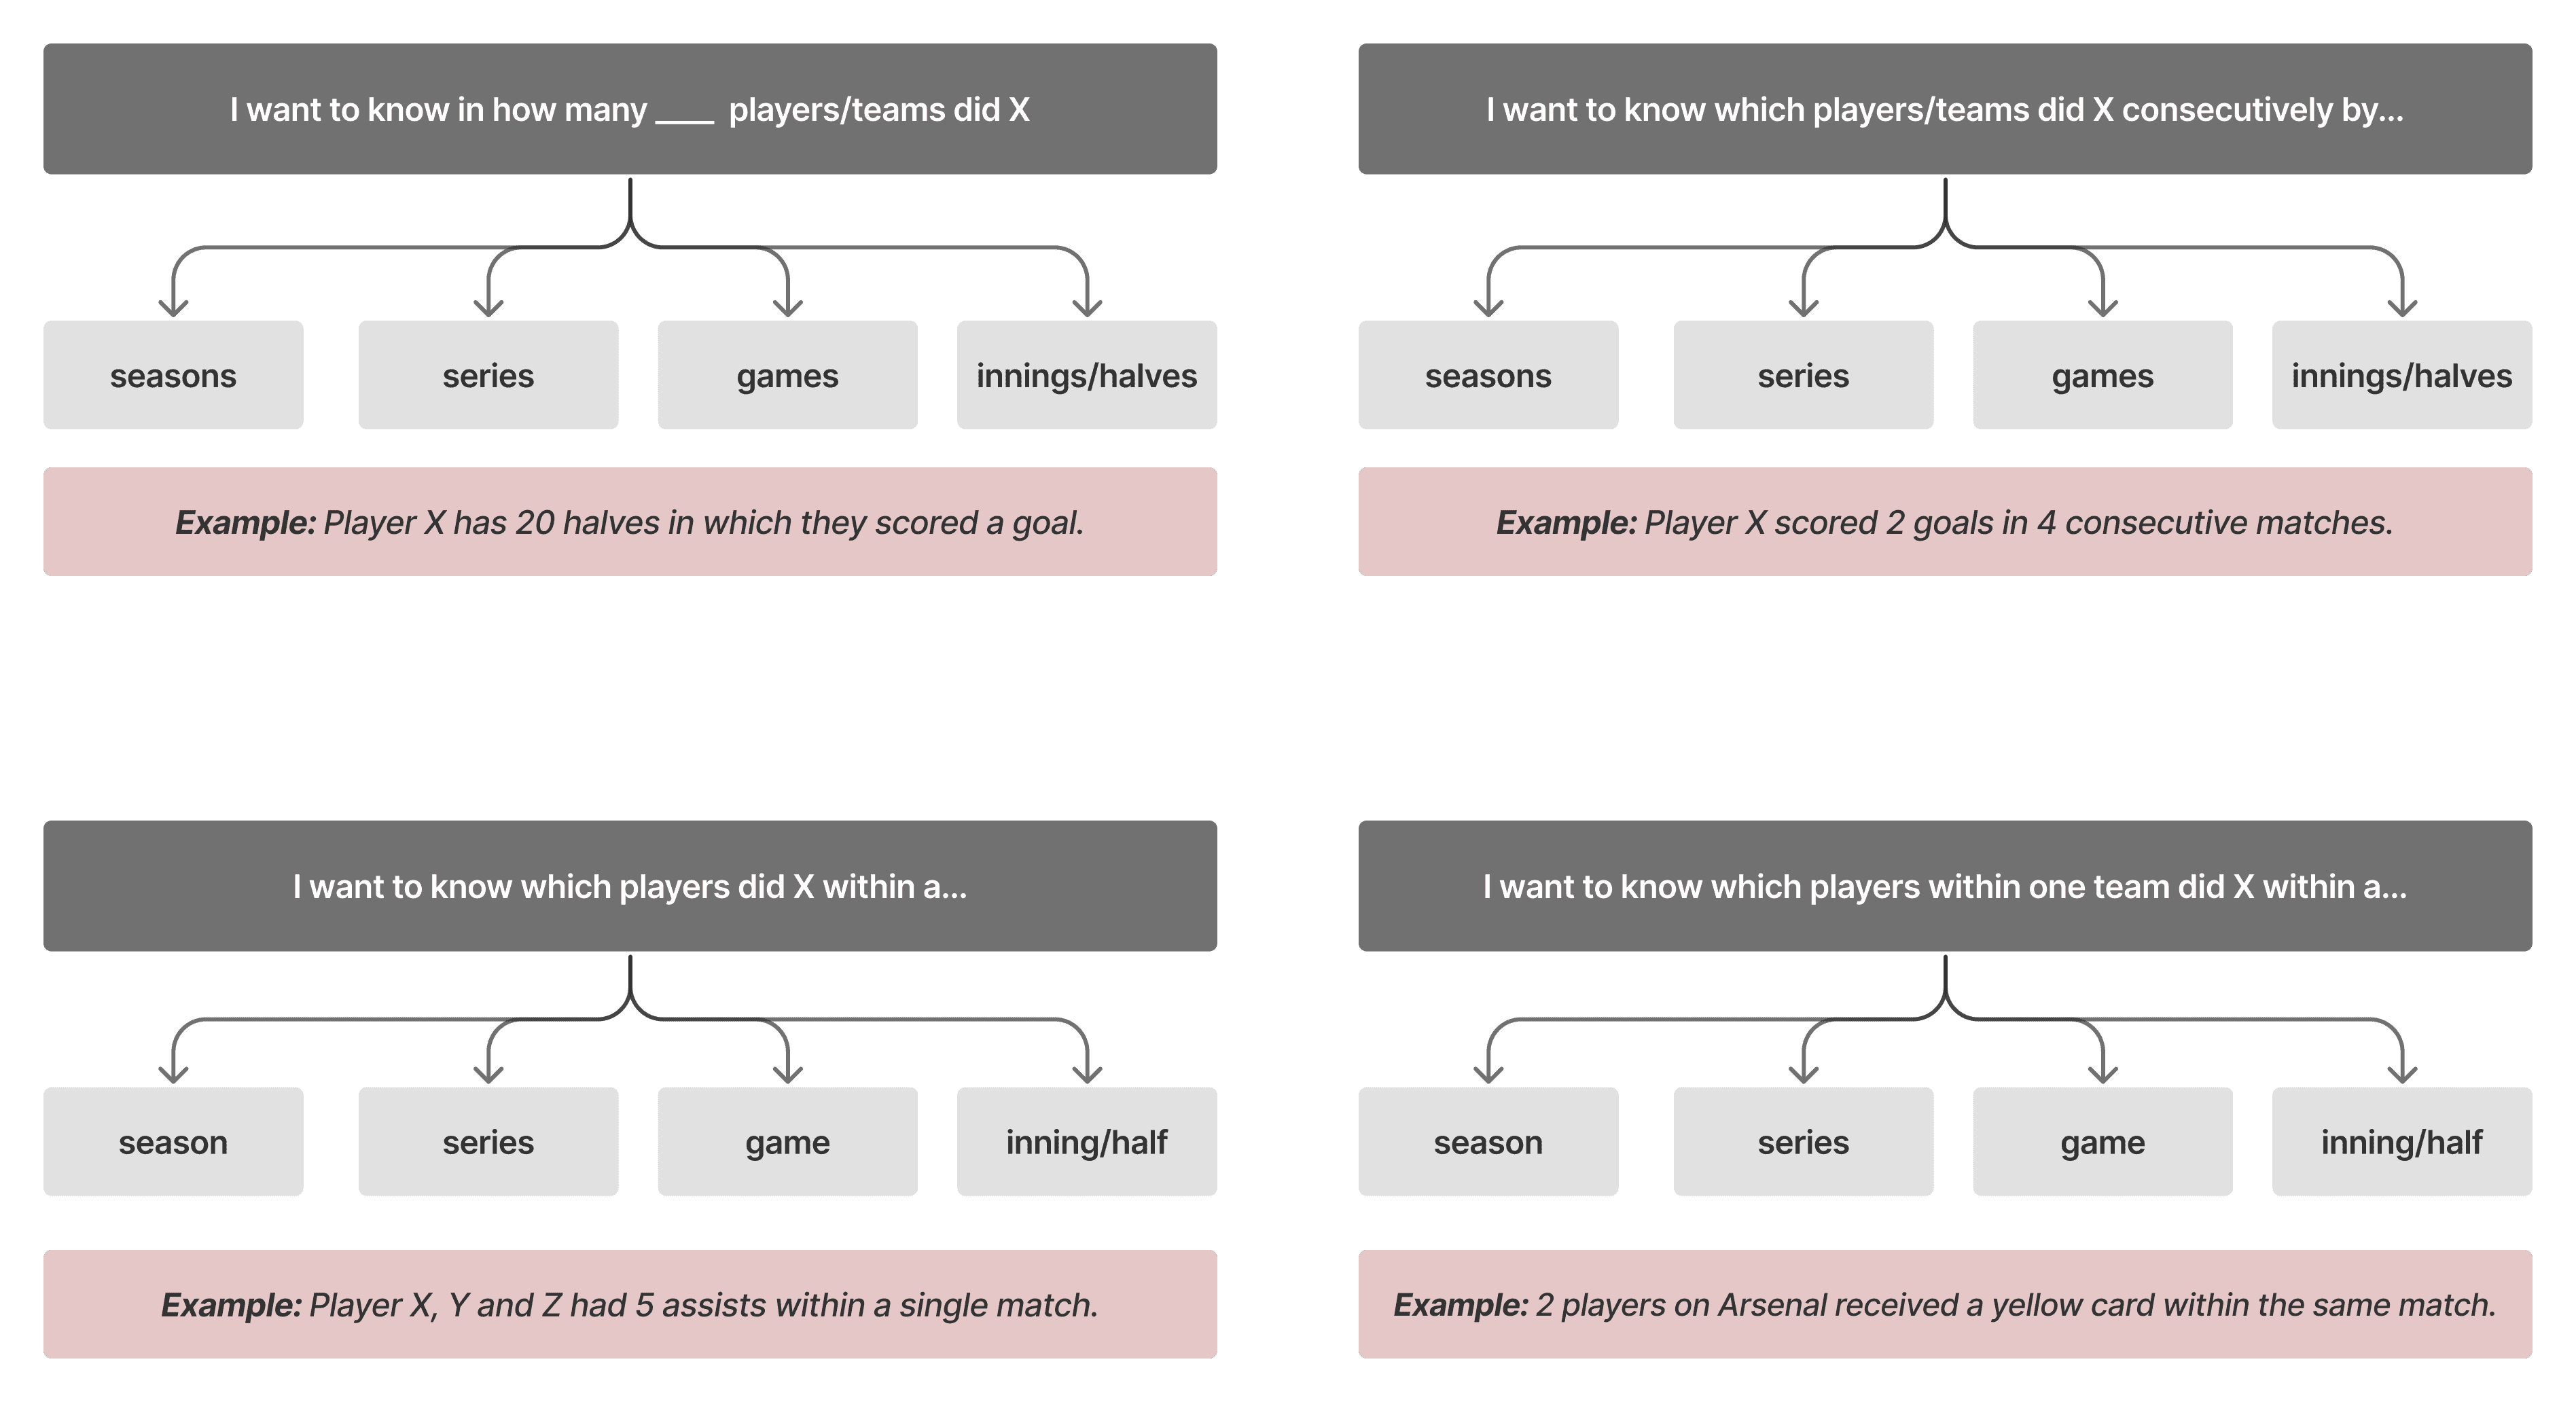
For advanced queries, Advanced Search introduced a concept called "Instances". This allowed researchers to define general criteria or specific conditions under which events occurred and create a custom output.
"I want to know in how many consecutive games Player X scored 3 goals—and if that streak is still ongoing."
If I see that Player X has scored 3 goals in 5 consecutive games, it can also tell me:
Who else has achieved this, and when?
How does Player X compare?
Will they set another record in their next match?

The builder went through several iterations. An all-inclusive one-pager was familiar but didn't handle and/or logic well. A tabbed wizard was easier to read but slowed experienced researchers down. A line-by-line search builder on a single page won in testing, balancing clarity with the speed these users expected.
Table interactions were designed around the same principle: less steps, more analysis. Researchers could pin rows to compare players directly, convert values to percentages or averages inline, and save data points to investigate later. Records and milestones in progress were surfaced passively throughout so researchers could catch something relevant without having to look for it.
Staging demo during active development. Development was ongoing at this point, therefore some elements appear unfinished or behave unexpectedly.

Mapping The Ecosystem Before Designing
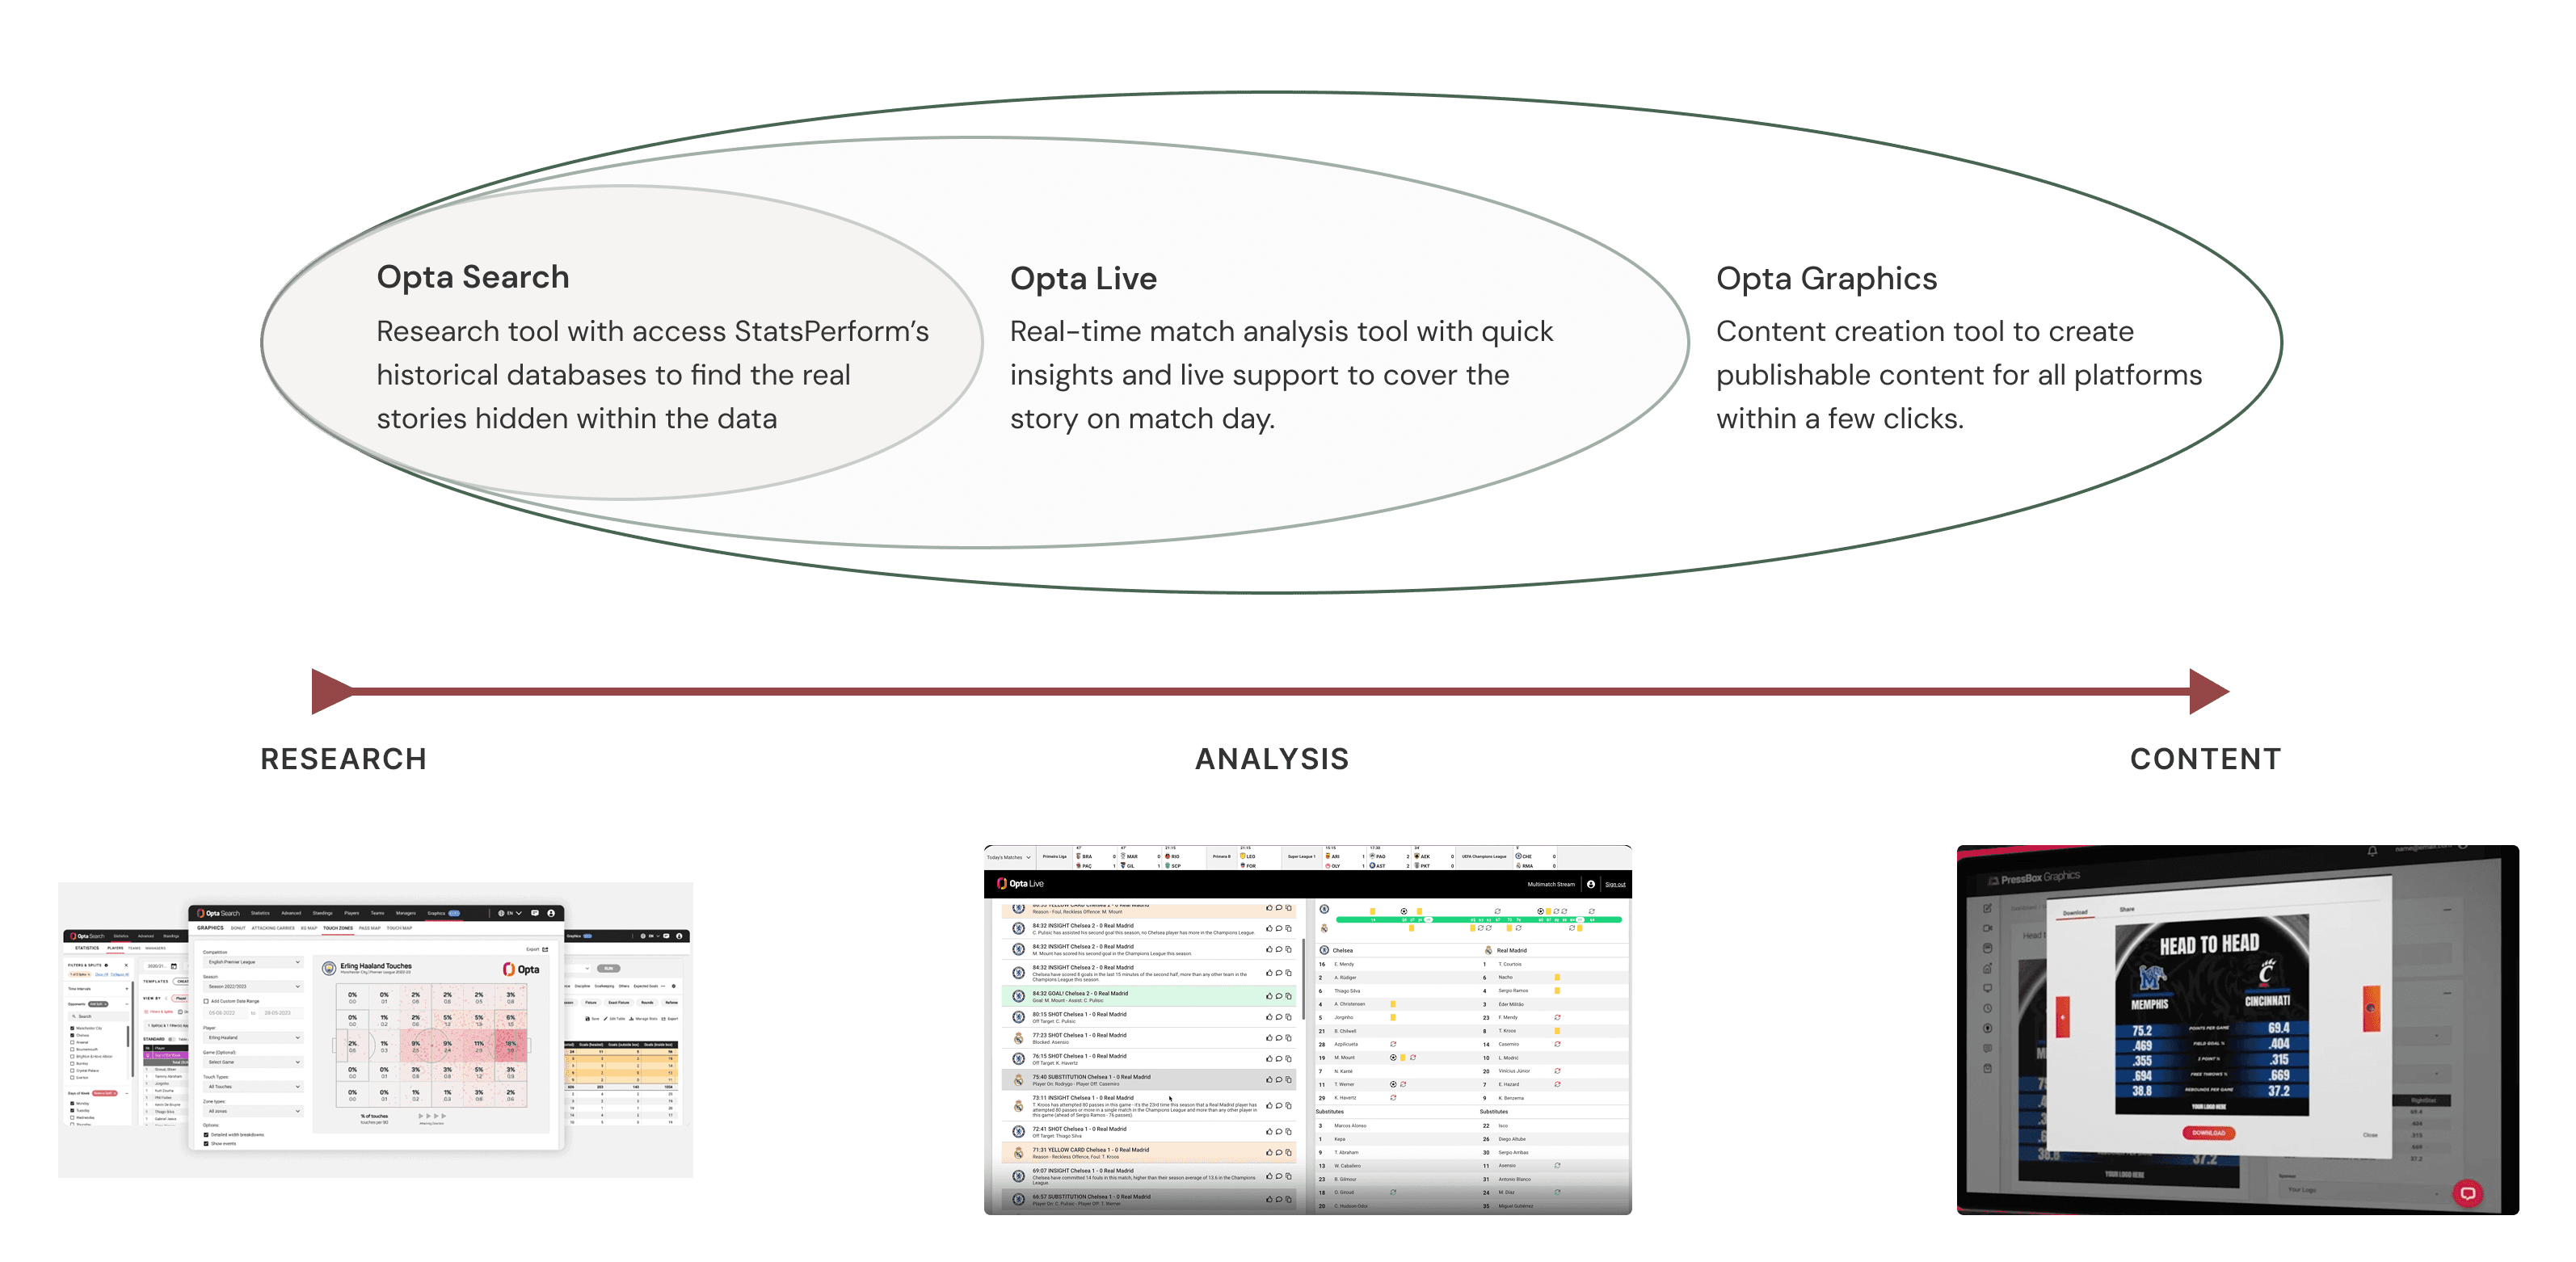
Opta Search sat within a broader product ecosystem including Opta Live and Opta Graphics. One of the earlier and more consequential pieces of work was mapping that ecosystem with product owners to define clear boundaries. What Opta Search owned, and where it should hand off rather than duplicate. Without that alignment, the platform risked scope creep.
Proto-personas kept the team anchored to real workflow constraints throughout design. With four distinct user types across multiple sports and regions, it was easy for requirements to drift toward edge cases. The personas were a practical tool for scoping decisions and resolving disagreements about what to prioritise.
Findings from regular help desk email audits and usability testing directly informed user requirements and drove key changes to the filter panel, the table layout, and the Advanced Search builder approach.
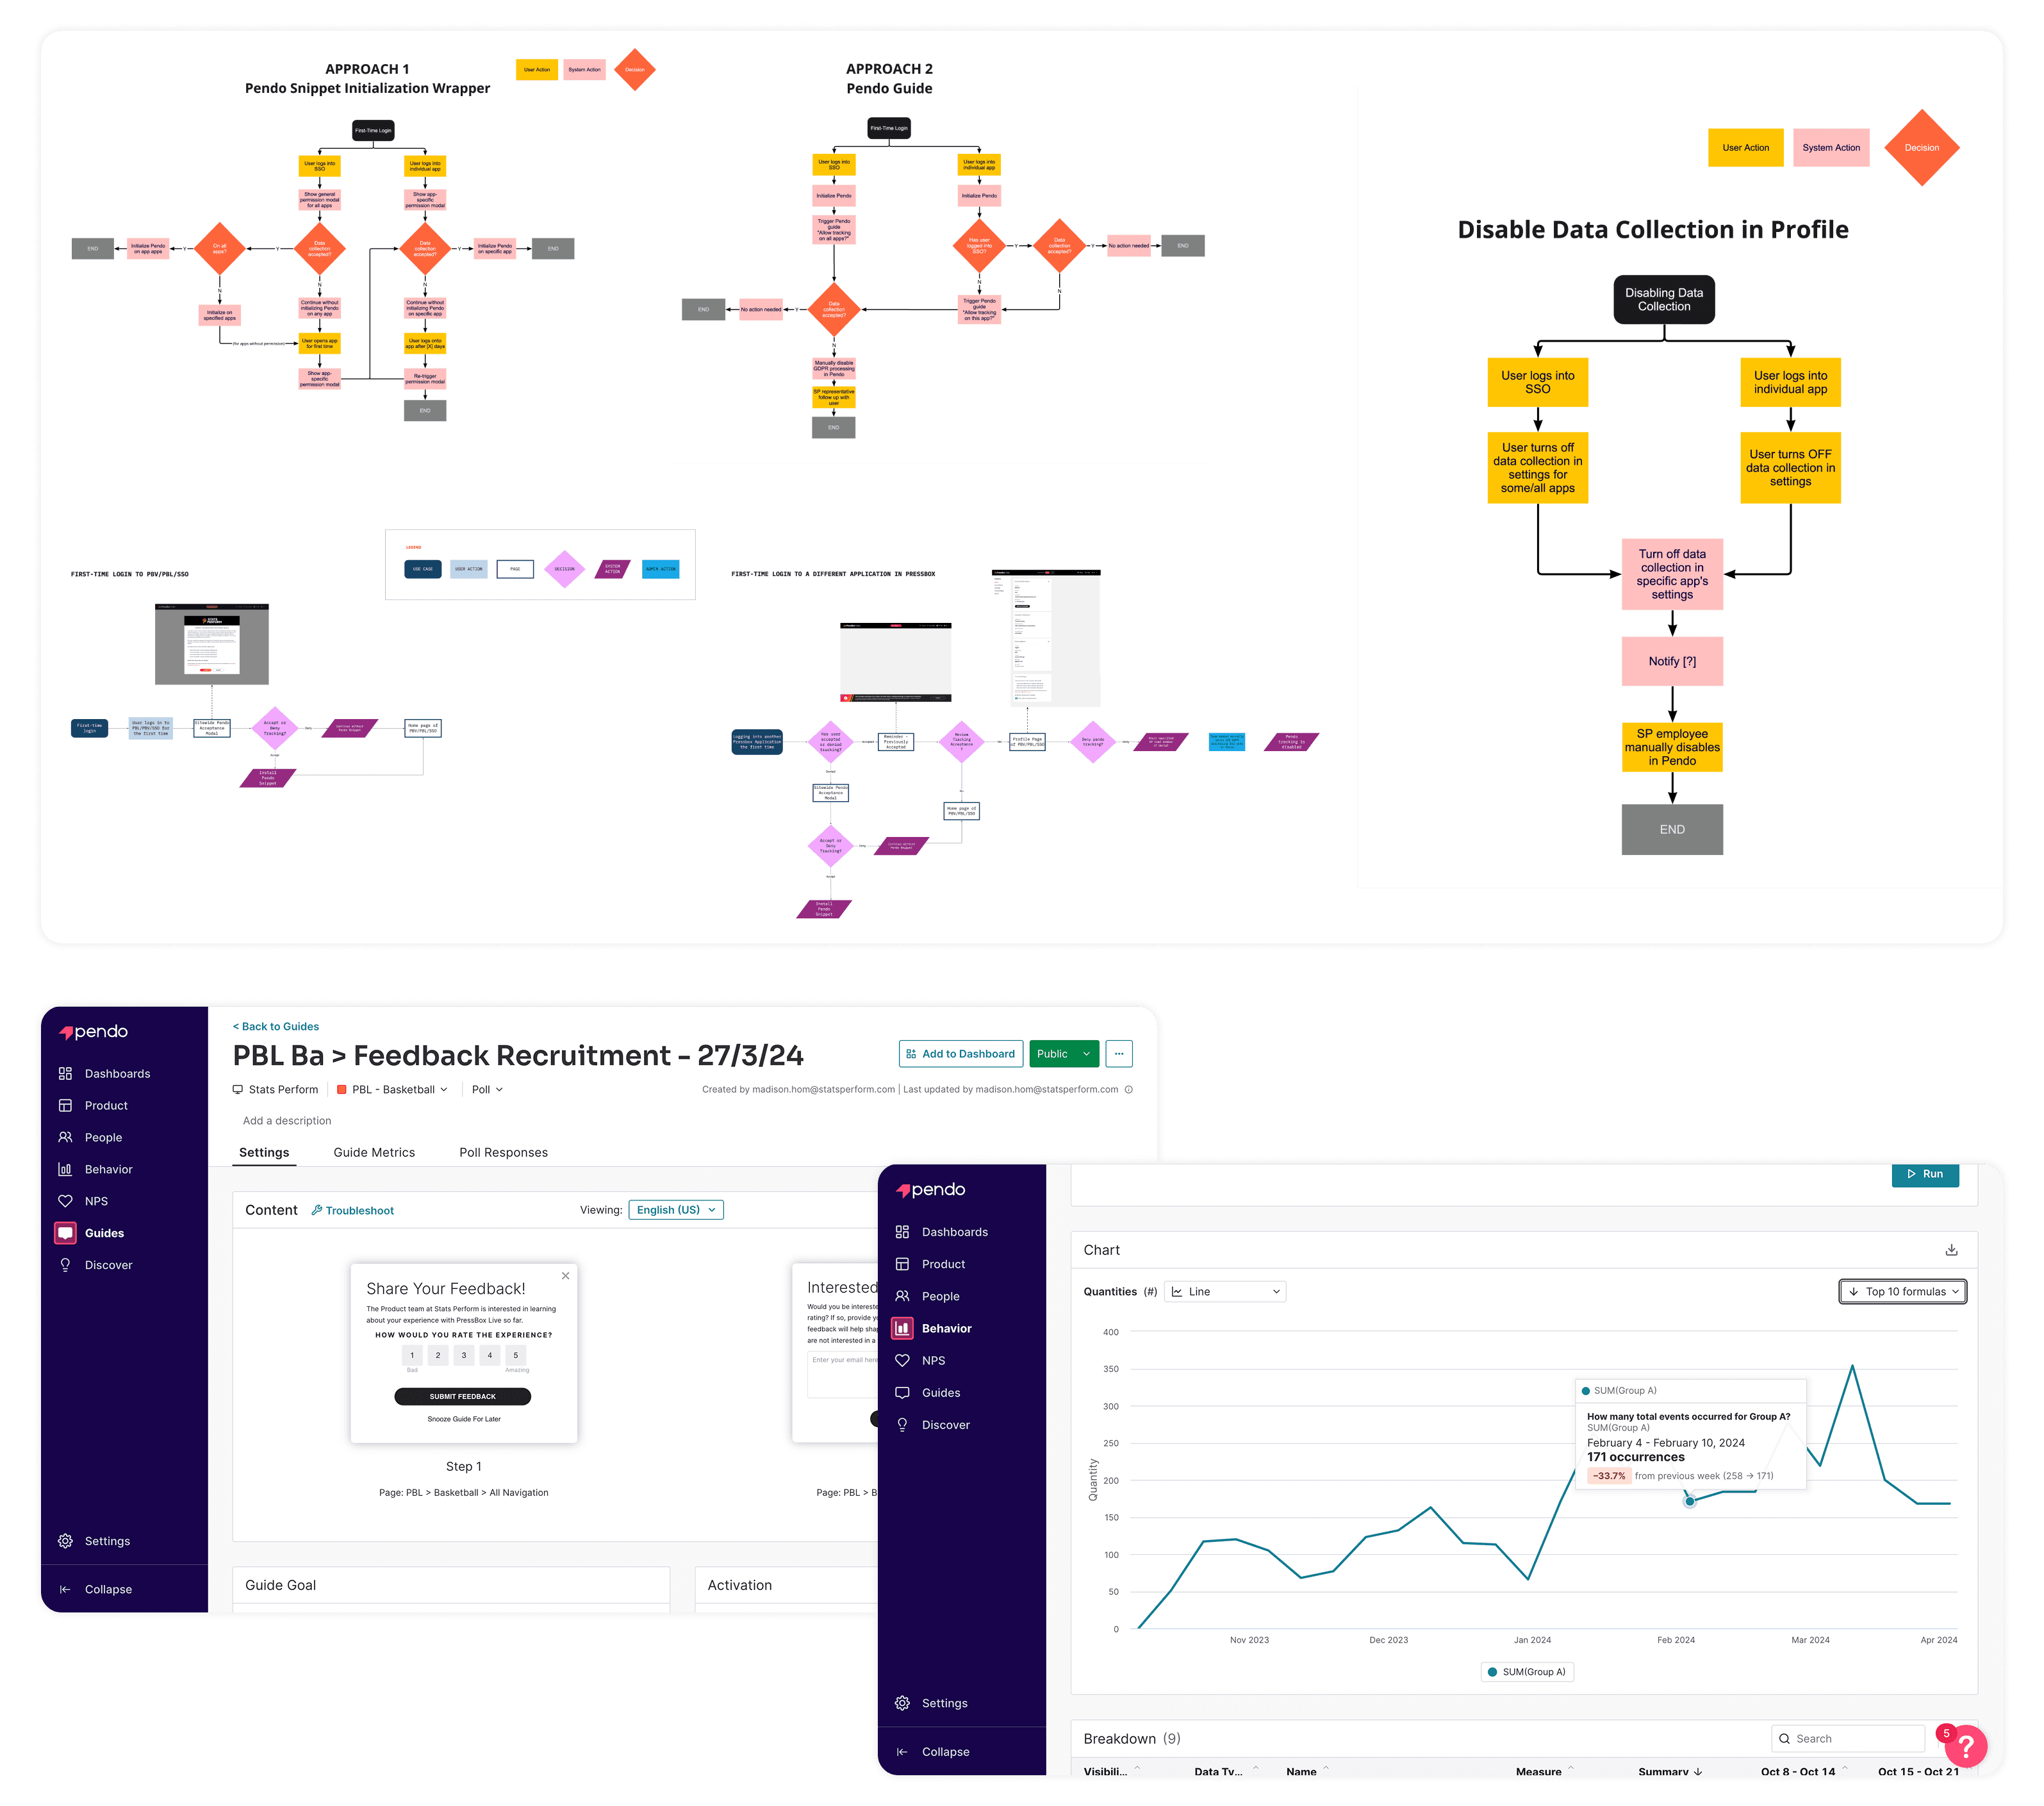
Toward the end of the project, I made the case internally for implementing Pendo Analytics across the product suite. With no usage data at the start of the project, the team had been designing largely from qualitative research alone. Getting approval for Pendo, and subsequently training product and design teams to use it for roadmap decisions, onboarding, and research recruitment, was as much a product contribution as any screen delivered.
I also proposed a Game Notes feature to extend the platform beyond data inquiry. Researchers were already ending every session by copying data into Word, writing up insights, and fact-checking before distribution. Building that output step into Opta Search directly and layering in Automated Insights, an NLG technology acquired by Stats Perform, would close the loop on the full research cycle.
This became an ongoing initiative rather than a launch feature, but it shaped the longer-term product direction.


Outcome
Opta Search launched in July 2024. Four new clients signed before launch, including the EFL League, Eredivisie, and the Saudi Arabian League. Three legacy tools were consolidated into one and Opta Search cut help desk volume by 20% through self-service, directly addressing the dependency the discovery research had identified.
Opta Search became the primary tool for both internal teams and clients, and Pendo was implemented across three Opta products to track adoption and inform future development.

Senior Editor
Stats Perform
“At first I wanted to say it’s missing the functionality I’d expect, but as I go through to find what I’m looking for I can see that it’s baked in where I need it. It’s great.”